
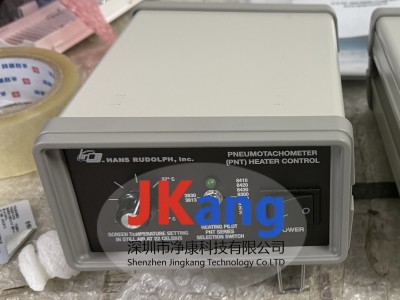



Characteristics of smartlab data acquisition system:
- Base module can accommodate up to 4 sensor modules
- Pressure sensor module, full range from 2 cm h2o to 350 cm h2o
- Absolute pressure sensor module for air pressure or high compensation
- Up to 5 calibration tables per sensor module
- +5 or +10 vdc simulation input module
- Two rs-232 serial ports to connect serobics and carbon dioxide sensors
- Optionally fitted with an internal oxygen concentration sensor
- Internal humidity and external temperature sensors。
- Working with all hans rudolph punimata
- Calculating tide and several breathing parameters from flow and airway pressure signals
- Data transferred via usb or wireless connection
- Up to eight data channels, up to 200 hertz
- 8 ttl digital outputs and 4 digital inputs
- A digital output can trigger a measurement
- When a trigger event occurs, measured and calculated values can be shown and saved
- Up to 8 graphic real-time waveform displays
- Each chart shows a maximum of 3 values
- Trend diagram for data showing slower changes
- Xy graphics for circulation
- Save and recall different configuration settings
- Recording and replaying data
- Keep the measured and calculated data stream in the text file for recording and further analysis
- Place manual and automatic tags in graphics and files medium
- Writes selected data to a file for each breath
- Optional simulation output module with 4 outputs
- Each map has two cursors to measure the value of a point and the difference between two points
- Software for calibrating lung functions with calibration syringes
- Size: 4. 5 inches high x 10. 5 inches deep x 10 inches wide (annexes only) i'm not sure
- Weight between five and six pounds. (2. 2 to 2. 7 kg) depending on installation options
- Services for custom software and hardware
- Need a computer to run windowstm7, 8. 1 or 10, i5 or better cpu and graphic cards
Smartlab 1140 respiratory data acquisition system, smartlab data acquisition system is an intelligent laboratory device with aero-sensitive sensors and carbon dioxide sensors
The smartlabtm instrument system with insighttm software is a flexible measurement system for breathing signals. It is a modular system that can be configured for various voltage measurements. The basic module consists of a main system circuit board that can accept up to four sensor modules or simulation input modules. It also entered noNin xpod aerobics, masimo irma co2 concentration sensors online and sidestream models and temperature sensors. An optional internal oxygen concentration sensor is also available. A digital i/o port with eight outputs and four inputs can be connected to a valve controller or other device that can accept a ttl digital signal. An optional model output module can be used to repeat up to four measurements or calculations。The currently available sensor modules include pressure sensors for hans rudolph, inc. Air bags, pressure sensors for airway pressure and absolute pressure sensors for air pressure or altitude measurements. The voltage input module can be used to measure analogue signals from other equipment. An internal temperature and humidity sensor and an external temperature sensor are optional. Other modules will be released in the future. If needed, customized modules could be developed. Sensors are calibrated and can be installed for on-site requirements. Each sensor module can accommodate up to five calibration files. If the flow sensor is measured by a gasket vessel, it can be calibrated to work with several gaskets, each with a unique calibration. The software allows users to select the calibration form for the current settings。
Example waveform display for insighttm software
Data are transmitted to pc via usb connection or wireless radio frequency connection. Up to eight data signals with a sampling rate of 200 hz. The pc software will display data of up to eight graphics and up to three signals per graphic. The trend map can also be configured to show slower data signals or calculation values over a longer period of time. Xy graphics are used to display graphics such as fluid circulation. Depending on the type of signal detected, several calculation parameters can be measured and maps can be drawn. For flow signals, the calculation of the breathing rate, i. E. E-scale, tide, peak flow and estimated leakage, is the calculation of some parameters. The flow signal can be calibrated according to the gas composition, pressure and temperature. When the pressure of the airway is measured, pressure parameters such as peak pressure, average airway pressure, vent pressure and others are calculated. Measurements and calculations can be saved in a text file for further analysis. The imported data can be stored with the settings in a playback file so that the data can be returned later. Another file type is the “breath to breathe” data file, which saves the selected parameter for each breath. There is also a feature that allows you to place custom tags manually or in graphics and files when an event occurs. Marks a user-defined text that is displayed on the map along with the associated signal and in the data file. You can save all settings for specific settings in a configuration file, and later you can take back the profile to copy the settings。