Hello, i'm k-sensei, and i'm sharing with you today a system of dynamic trends。
If you also have the same confusion about watching stock prices rise, but always at short-term heights; falling stock prices want to sell and cutting in the bottom zone?, then it would be interesting to learn about this dynamic trend-turning system, which, by quantifying trend dynamics and breaking signals, will truly achieve precision capture of the main rise。
I. Side in: why do you always miss the main lift
Common operator error:
Case 1: in 2023, an ai concept stock went through the sun, followed by high post-mortem prices, which fell by 12 per cent over three days - the subsequent discovery of a lack of momentum in the event of a breakthrough is a false breakthrough
Case 2: a small rebound of a consumption unit after a low-level shock, with the result that stock prices have again fallen to lower levels for fear of missed access — ignoring the key signals that the trend has not really reversed。
At the heart of the problem lies the lack of quantitative judgement of trends points. The code is based on a triple mechanism of trend kinetic energy + break signal validation + dynamic loss and loss control, which helps you to filter ineffectual fluctuations and lock down trading opportunities that really have the potential for a major rise。
Description of code function: triple mechanism to lock trends points
Core objectives
Quantified trend kinetic energy: calculation of trend kinetic energy indicator a1x by ema margin to determine trend strength and direction
(b) validation of the effectiveness of breakthroughs: setting conditions such as breakthroughs, kinetic energy mutations and avoiding the recovery of false breakthroughs
Dynamic risk control: automatically generate 10-30 per cent of the amplitude line and 0. 9 times the loss line and streamline the risk control process。
Key parameters
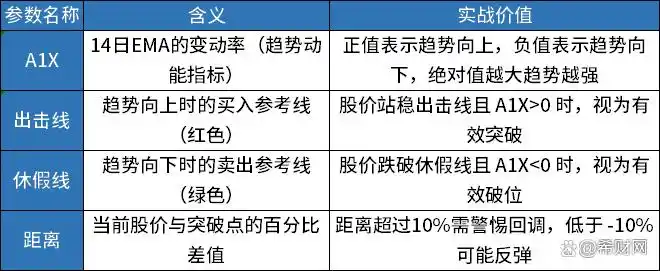
Modularized dismantling: the logical chain from data to signals
1. Trends in kinetic energy calculations
A1x: = (ema(c, 14)-ref(ema(c, 14), 1)/ref(ema(c, 14), 1*100;
# calculation of ema's rate of change at 14 days (current value - previous day) / previous day's value* 100
# example: a1x=5 indicates a 5% increase in ema from the previous day on 14th, with an increased trend
Breakthrough: ref (ema(c, 14), nodraw; # record ema on the 14th day of the previous day as a breakout reference
Market logic:
A1x is the core indicator of trend kinetic energy, with mcd-like dif lines but more intuitive: a1x>0 and increasing, the trend is stronger; a1x
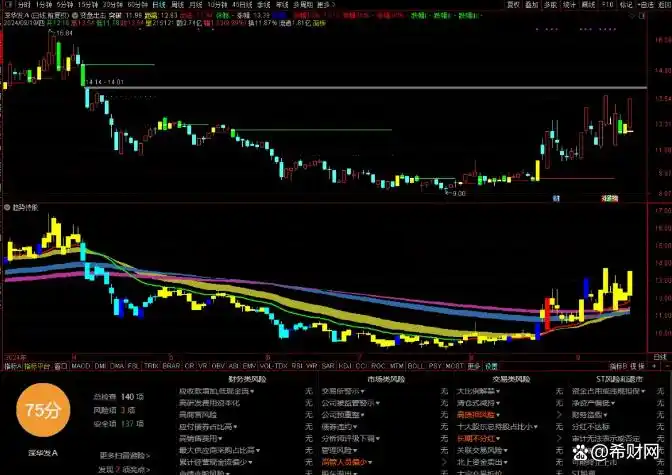
The effectiveness of the trend was validated by the steady upward movement of a1x from 3 to 15,14 in the early start-up of a given computing unit in 2023。
Trade reference line generation
Attack: if(a1x>=0, ref(ema(c, 14), barslast(cross(a1x,0))+1), drawnull, colorred, linethick1;
# when a1x = 0, draw red firing lines (ema on 14th of the previous day)
#barslast (cross(a1x,0))+1 indicates the number of days since the last a1x gold fork, ensuring that the firing line continues to show
Leave: if(a1x)
# when a1x
Signal interpretation:
(a) red strike wire: trend-up reference buy-in position, e. G. $12. 5 when the a1x on a consumption share in 2024 passes through a 0-axis line, then the stock price rises to $15 after the shock above the firing line
Green leave lines: trends are down to a reference slot, with 28 yuan when a medical unit a1x wears a zero-axis line, and the price of shares continues to fall to 22 yuan after falling。
3. Dynamics and loss
10 per cent increase: if(h> = strike*1. 1, strike*1. 1, drawnull), colorred, pointot;
# upline + 10% no-gain reference (red dash)
Decline i: if (l 15%), industry landscape (e. G. Policy support) combined judgement。
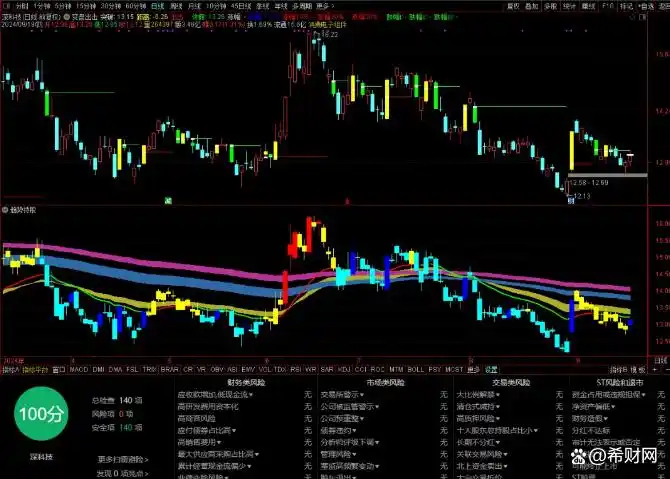
End: the essence of trend trading is that it's "in-the-side."
The value of this system of dynamic trends points lies in replacing subjective judgements with quantitative rules, but it does not guarantee the success of every transaction. It is recommended that the simulation disk be operated for three months, with a focus on observing differences in the performance of signals in different industries. Remember, the real trend trade is not predicting the future, but following market dynamics -- entering the field when trends are confirmed, leaving when trends reverse, that is the core logic of quantitative investment。
(risk alert: this paper is a technical exchange and does not constitute any investment proposal
"intelligence"
Focus on "kline formulae says"