I. Definition and formulae of the line
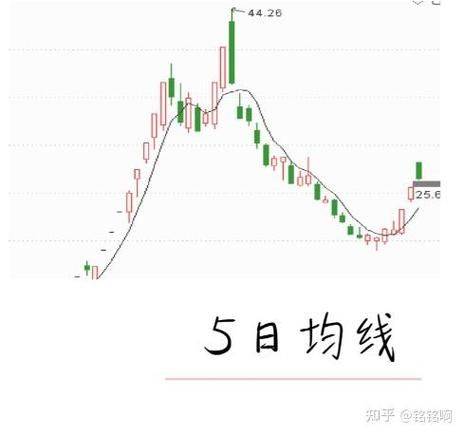
Summarizing the closing price of a given number of units, n, averaged the average of the stock price over that period, i. E. The n-day average. Linking the average price at each point of time into a curve, it forms the n-day line。
Two algorithms of average and weighted averages can be used for the calculation of average prices, in which the average method of arithmetic has the same as the closing weight of each point of time, with the same effect on the average price. The weighted average method, however, considers that the impact of the closing price in the near term is greater, hence the higher weight, and that the effect of the closing price in the prior period is reduced, thus reducing the weight。
In the absence of a computer, the average price of the previous day would be reduced by 1/n, plus the closing price/n for the same day, in order to calculate the average price for convenience, and the new average price, known as the mobile method, would be obtained. It is therefore called ma (moved approach)。
Calculation formula: ma = (c1+c2+c3+...+cn)/n
C: disclose price for one day n: move average line life
Ii. Setting and average cost of average parameters
The time parameter n in the calculation of the average price can be taken broadly, and depending on the n, the balance is divided between the short, medium and long term。
If the observation were to have a k-line map of the stock price with a long- to medium-term mean, it would provide a visual view of the positive trends in stock prices, which, together with short- to medium-term averages, accurately reflected the dow jones theory。
Based on the calculation of the average price, it is generally considered that the average line approximates the average cost of the n-day purchaser. Depending on the trade mentality of the person, the cost price has a significant impact on the buying and selling behaviour of the trader. It is therefore possible to speculate on the possible conduct of transactions by different investors on the basis of the relative relationship of the equity price to the median。
Iii. Short, medium and long average applications
The short-term average reflects the cost of active investors, the medium-term average reflects the cost of trend-band traders, while the long-term average is the average cost of long-term shareholders with large capital. These different styles of traders also determine the different application methods of the cyclical averages。
There are many types of applications based on the ratio of share prices to the averages of different cycles. The most direct is the so-called support and pressure. Support is the constant upward movement of a low stock price along an average line, and the pressure is the opposite, with a high stock price going down along an average line。
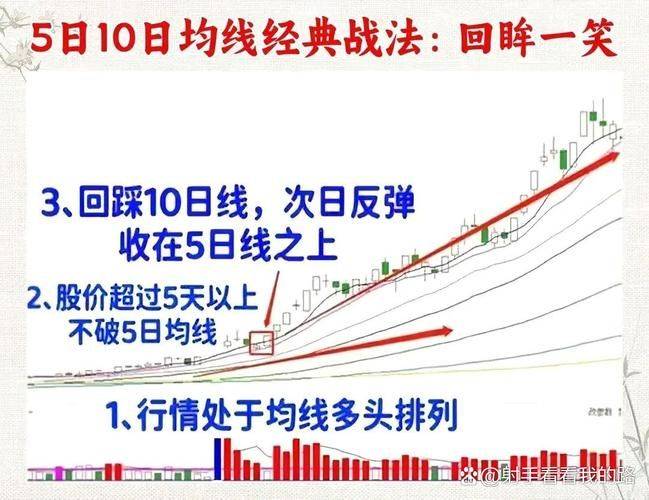
The other is the so-called empty and multi-heading, which refers to stock prices forming, together with multiple averages, a standard path of rise or decline, indicating a clear trend in stock prices。
Another is fragmentation, where there is a growing relative price gap between stock prices, short-, medium- and long-term averages, indicating that stock prices are operating at an accelerated stage. At this point, short-term changes in stock prices cannot be judged by the mere use of the average, and must rely on other technical indicators, such as a good faith rate, kdj, or a smaller daily cycle, or a direct view of the k line。
There are two principles in determining the direction of the curve: the principle of conformity and the principle of reversal. The principle of wiring is that wiring is subject to weeklines and small cycles are subject to large cycles. The principle is that a bottom-up reversal requires a huge trade, and the size of the trade represents the magnitude of the reversal. Since the downward trend is downward, smaller cycles are subject to larger cycles, and reversals are often not easy。
Iv. Relationship of stock prices to average
There is a entanglement and convergence of stock prices with the mean line. Worthy state refers to the sudden ups and downs between stock prices and the averages, with the appearance of oscillation without trend. The convergence is a gradual convergence of the cyclical averages, while the volatility of stock prices is narrowed and stock prices are likely to evolve。
It is also the widest, most diverse and most effective use of the field, based on the relationships between stock prices and cyclical horizons. In the end, many of the experts basically returned to the average, the k, the trade and the form。
V. Performance indicators and application
What's the good faith rate
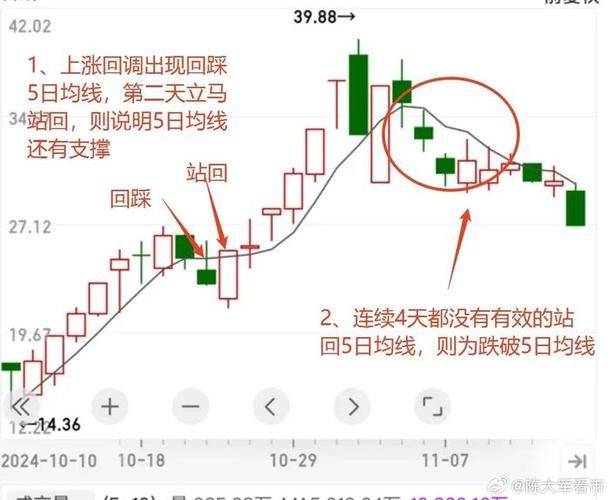
The good faith rate is the degree of deviation between the current stock price and the corresponding average price and is generally expressed as a percentage of the deviation. Accompaniment rates are generally used in extreme situations of boom-and-fall, depending on historical trends, with different extreme values for different types of stocks, with small extremes for general indices, large plate blues, and possibly large for small holdings and shares。
The good faith rate indicator is a technical indicator derived from the mobile average。
Formula: good-faith rate =
(cash price on day -- n-day average)/n-day average price
100%
Risk tips: the articles are for reference purposes only and do not constitute investment recommendations. Investors operate on this basis and risk is borne。