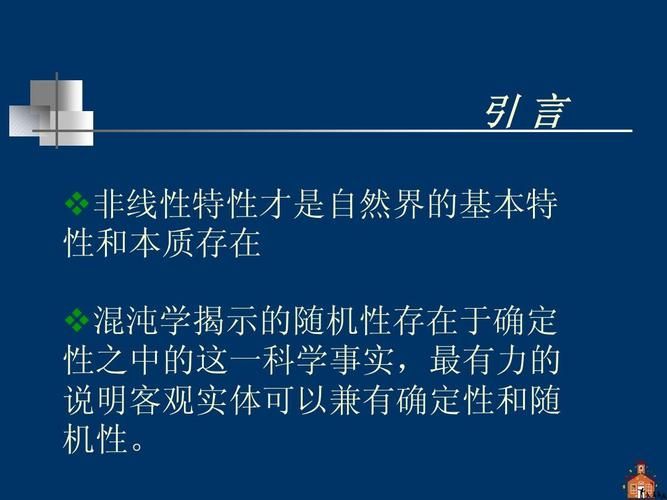
Convergence theory of confusion the convergence of profit act, 1963 (chaos), introduced by the american meteorologist edward norton lorenz. The greatest contribution of the theory is to obtain clear non-cyclical results using simple models. Research in the fields of meteorology, aviation and space plays an important role. Dr. Bill williams, a well-known wall street financial analyst, creatively applied the chaos theory to the maturity market, known as the “consistent profit method”. Plato's “mix theory” allows us to look at the market from a new perspective. It enables us to see the underlying architecture for controlling market behaviour. When you learn about the chaos theory, you'll know why successful deals are dancing with markets rather than fighting them. When you understand and apply this method, you can escape most of the trade pressures. You will find a series of simple and gradual steps that can lead you to successful deals. One of the key to the profit of trading in the new “5” bullet-gullor skeletal fracturing ao dynamic oscillation indicator acvi is to resonate the benefits of trading in crocodile groups by operating only those transactions that have the best potential, avoiding a very low profit; markets that do not work for most of the time, with only 15-30 per cent of the time; how to judge trends (traffic) is an important issue; the gator line helps us to intervene in the real trends and avoid dealings that erode our profits. What's a crocodile group line is basically a set of balancing lines between fractal geometry and non-linear dynamics. 1) alligator line (blue line): this is the balance of the current time frame as shown in the chart, which is a smooth 13-day moving mean line and moves 8 units to the future. 2). Gears (red lines): this is the balance of the low-level time frame shown in the chart, which is the eight-day smooth moving mean line and moves five units to the future. 3) lipline (green line): this is the equilibrium of a lower time frame shown in the chart, which is a smooth five-day moving mean line and moves 3 units to the future. Gold, from 2000 to the present peak price of 1921 lip-lined gatorlines, 2. The purpose of the crocodile formation line) provides an integrated way of monitoring the dynamics of the market. 2) provide a simple indicator of the timing of transactions only in the current trend. 3) construct a protective mechanism to avoid losses in the box-shaped, inter-districtly restricted market. Fractal geometry was created in 1975 by the mathematician, b. B. Mandelbort, on the basis of which the science of the nature of the fractals and their application, known as fractal theory, was developed. The initial fractal fractals are defined in their application: in one fractal, there must be at least two strips previously and subsequently, both of which have a lower maximum price (upward fractal) or their lowest price (downward fractal). In the upward fractal we consider only the highest price of the barchart, and in the downward fractal we consider only the lowest price of the barchart. Upper fractal means buying a signal, lower fractal means selling a signal. An effective division of the upper and upper parts of the upper and lower parts of the upper and lower parts: the upper fractal must be above the crocodile line; the lower fractal must be below the crocodile line to be called a valid fractal. When the crocodiles' jaws, teeth and upper lips are closed, converged or entangled together, we know that the crocodiles are going to sleep or are asleep. As its sleep continues, it becomes more hungry. When the crocodile wakes up, the first thing it does is to open his mouth and yawn, and then it smells meat, whether it's beef or bear, and it starts chasing. Sleeping crocodile hungry crocodiles act like we're dealing with the first fractal break outside the crocodile's mouth. For example, if the price is at the top of the crocodile's mouth, we'll only use the buy-in signal, not empty, until we take the lower of the last two subtracts. In this downward trend, we will only use the signals sold below the crocodile mouth, rather than doing more, until we lose the two most recent upper-fractal ones. The first deformation outside the mouth of the sleeping crocodile, the hungry crocodile, sells the first deformity outside the mouth of the signal crocodile, and the ao indicator ao indicator, set to stop damage after entry, is called the dynamic oscillation indicator, which measures the instant motion of the past five price lines and compares them with the dynamics of the past 34 price lines. Ao indicators tell us exactly what's happening with the current momentum. At least three columns are required for the ao indicators to buy in a disc to produce the signal. C must be a green column greater than b. Sets a buy-in sign at the highest price of more than one of the respective price lines corresponding to the first higher column in the column chart. Abc zero-axis disk that buys the signal ao indicators here in condensed discs and sells the signal requires at least three columns to generate the plate-buying signal. C must be a red column greater than b. Sets a selling mark at a price below the lowest price of the corresponding price line corresponding to the first higher column in the column chart. The abc zero axis, which buys the signal ao in a condensed disc, crosses the signal line indicated in signal b, crosses the zero axis and must be a green column. The first column through the zero axis corresponds to a price line, and the purchase of the mark should be set at a price point above the highest price of the price line. Ab zero through the ao indicator, where the ao is traded, cross the signal line indicated in signal b, cross the zero axis and must be a red column. The first column through the zero axis corresponds to a price line, and the selling mark should be set at a price level below the lowest price line. The signal is generated when the double-buying signal of the ab-zero axis, which crosses the ao indicator of the zero axis, reaches a peak downward, followed by a peak higher than the previous one downward. Between the two peaks, the column chart must be below the zero axis and the signal is invalid if the zero axis is crossed between the peaks. C must be a green column with an absolute value less than any peak. First peak, second peakc, second peakc the signal is generated when the double point of the ao indicator is sold up to a point of upward peak followed by a peak below the previous one. Between the two peaks, the column chart must be on a zero axis and the signal is invalid if the zero axis is crossed between the peaks. C shall be a red column and its absolute value is less than any peak. The first peak, the second peak of the second peak of the first peak,c is here measured by the acceleration-reduction rate of current momentum in the cac indicator ac indicator. Ac indicators are known as acceleration oscillation indicators. The ac buys signals above the zero axis when the height of the two continuous columns is higher than that of the nearest minimum. A is a red column and is below the previous column. B must be green and above column a. C is a signal line, which must be green and above column b. When abcabc buys a signal column chart below this junction-zero axis to form three columns that rise in descending order of point, and the low points of these columns are above the lower peak of the most recent minimum column. A is the red column, the lowest peak. B is the first rise in direction, and must be green. C is the second continuous rise and must be green. D is a signal line and must be green. At this point, abcdabcd's ac indicator buys the signal ac column at a peak below the zero axis, and after the peak passes the second or third column through the zero axis, it produces a buy-in signal. A must be a peak down and red. B above column a and must be green. D is a signal line, above the zero axis and must be green. Abcdabc sells a signal below this cut-off zero axis when the lowest point of the two continuous columns is below the upper peak of the nearest maximum. A is the red column and the highest at the low point. B must be a red line, lower than a column line a. C is a signal line, which must be red and is below b. Abcacb sells a signal column at this point above the 0-axis to form a three-column line down in order of high points, and when the height of these columns is at the peak of the most recent highest line, to produce a signal. A is the green column, with the highest peak. B is the first drop in the column that causes a change of direction and must be red. C is the second continuous line down, which must be red. D is a signal line, which must be red. Abcdabcd here sells a signal ac column through a zero axis at a peak above a zero axis and then a second or third column after a peak cross a zero axis, producing a sign of sale. A must be an upward peak and green. B is below column a and must be red. D is a signal line, below the zero axis and must be red. Abcdabc's good start is half a success, and a “zero” opportunity can give us a good start. “zero points”: alligator clusters entangled; ao, ac indicators approaching zero axis; effective fractal。the first schizophrenia of the crocodile group entangled around the gator's mouth to buy the signal ao, ac approaching the three magic averages of the zero axis, the 21st, 89th and 356th antennas forming the nearest effective subtract outside the resonance gator's mouth, sets the “zero point” opportunity yellow line up to the standard point: the 21st sill: the white line: the first sill of the 89th sill: the technique of buying the signal to the profit of the 356th siphon: the ao indicator 5 is the same-colored red line (the teeth of the crocodile's lip) in the reverse direction of the green line (the lip of the crocodile), and when we enter the field, we have five continuous homogenous lines, so that we can place our nostrils above the maximum price of the k line, which corresponds to the 5ao column line. When the 6th price line has a lower maximum price, move the no-gain position to the top of the 6th line until you are out. When we enter the field, the first fractal of the crocodile's mouth is sold, and five consecutive lines of the same colour are set at the corresponding k-line position, where five consecutive lines of the same colour are marked, and five successive lines of the same colour are present, so that we can set our noose below the lowest price of the k-line that corresponds to the 5 ao-column line. And then set up a follow-up level, which usually takes us out at the lowest price in the downward trend, or at the highest price in the upward trend. The first fractal buy-in signal outside the gator's mouth shows how the red line can keep you in the extended trend, with five homogenous lines at the stop point. The first one on the right is at the line k, which runs through the red line, and which is more expensive than the red line, so we remain in the market for more. At the second line of k, the closing price of the k line was lower than the red line, so we left when we closed. The red line off-site mark is especially suitable for a “blow-up and drop-out” eruption when the red line off-site mark is more expensive than the red line off-board on less than the red line green line off-site mark. When the price movement has a larger angle than the green line, we define it as a “blowing up” market. The similarity of the green line off-site marked at the red line off-site is that both are off-site sheets. The deviation between the closing price of the green line below the green line price and the momentum is on an upward trend, when the price is higher than the top of the most recent price, while the momentum is lower than the maximum of the last price. In other words, when the price is higher and the momentum is lower, this is the deviation between the price and the momentum. As the market puts it, gold fell by 970 points within eight hours, or more than us$ 9,700 per hand contract, so far we have broken down the whole “consistent profit method” of profit from stock and futures markets. Good and sustainable trading is the result of combining appropriate attitudes with appropriate tools. New scientific bases provide us with the best tools, and we need to combine them with appropriate attitudes so that they can ultimately be applied to the profits of transactions. Trade in the grail market, whatever i want. Go ahead. Michelangelo has pointed out that there are two ways to create statues. The first is to create a statue from a collection of materials. The second approach is to see the statue already present in the material, which is simply the process of removing material that does not belong there. We need to sum up the reasonable control position. I put it first, because only with reasonable control of the position will you have the chance to stabilize your profit, or else your account will be a failure. In general, 10 per cent of the funds are entered. Set it up. Remember, a greedy mistake can cost you three months of profit. Mind control. The basic element of price change is human emotion. Panics, fear, greed, insecurity, fear, pressure and hesitation are the main causes of short-term price movements. The trend is done. The best way to win is to follow the trend. Make plans for your business; execute your business as planned. Never let a big win turn into a loser. If the market makes your profits fall from the top 20, it's hard to calm down, or stop. Thank you for joining the group: 227826510