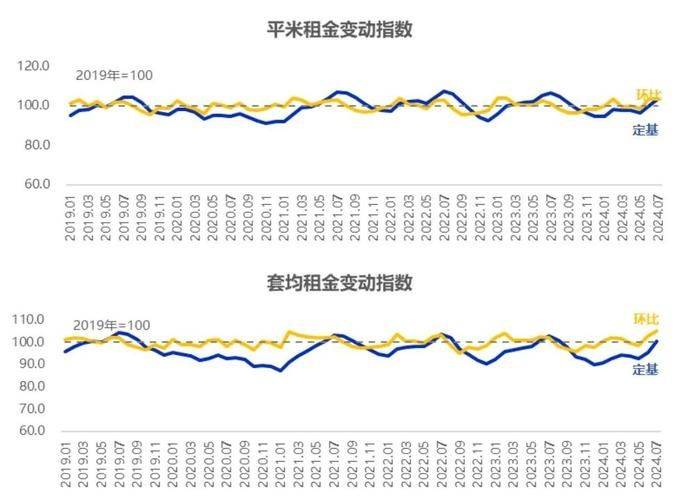
Method of calculating the department store, shopping mall rental index
A dynamic commercial property market needs an indicator tool that reflects trends in the price levels, volatility and variability of store rents and provides a basis for decision-making and reference for store investors, operators and various investors。
The real estate index enables investors, operators and managers to keep abreast of the factors affecting real estate changes and their extent; and diagnosses the current state of real estate and predicts future developments. In particular, local real estate indicators have the advantage of being able to reach out to specific regions, business types and obtain new data in a timely and accurate manner, thereby reducing prediction errors and making the indices more relevant. The breakdown of the real estate index is a need for real estate market development。
1. Sample selection and replacement
Sample selection and survey methodology
Survey project size: above 5,000 m2. The comptoir rental index uses a sampling method, i. E. A sampling sample based on expert judgement or the investigator's subjective decision。
Adjustments to sample stores: replacement adjustments to samples when the base period is longer than the calculation period or the sample store is no longer representative。
2. Calculation criteria
Frequency of index calculation: quarterly calculations based on the specialty rental index for real estate。
Determination of weights: the weights for calculating the merchant rental index are those based on the business space of the merchant。
3 the formula
Theory foundation
The public calculation results of the selection of the qualitative indicator index, using a weighted composite average method, indicate the direction and extent of the change in the aggregate quality indicator for complex phenomena, i. E. The impact of price changes on sales。
1) laze index: the laze index fixes the same measure factor at the base period level, also known as the “base period weighted composite index”, which is in essence an algorithm of a changed arithmetical average。
The lvpi formula is:
Of these, the quality and volume values for the reporting periods p1 and q1 represent the quality and volume values for the p0, q0 base periods. The lvpi uses the sales volume of commodities for the base period as a measure of homogeneity, indicating that it looks at the degree of the combined price movements of various commodities on the basis of the volume and structure of sales for the base period。
2) pasce index: the paste index, which fixes the same measure at the level of the reporting period, is also referred to as the “weighted composite index for the reporting period”, and the paste formula is in fact an algorithm that reconciles averages。