Of course, the characterization of complex organic compounds is also based on analytical methods such as infrared spectrum, ultraviolet spectrum, and magnetic resonance。
The resolution of mass spectrometry is a very difficult thing. Since the introduction of on-line computer access, and especially today of the database, although the manual analysis of the el mass spectrometry has become less and less, the manual resolution of mass spectrometry, especially of compounds that do not exist in the spectrographs, has also served as a means of testing and supplementing the results of the computer search, in order to deepen understanding of the molecular breakup patterns of compounds. Also, in the ms/ms analysis, the analysis of the ion spectra is not currently available in a readily available database, mainly by hand. Thus, learning about some mass spectrolysis is still necessary。
El mass spectrolysis
Determination of molecular weight
The mass ratio of the molecular ion is the molecular mass of the compound. Thus, the determination of the mass spectrometry begins with the determination of the molecular ion peak, which is usually determined by:
1. Molecular ion peaks must be the highest mass in the mass spectrum and should be at the right end of the mass spectrum。
Molecular ion peaks shall be lost of reasonable mass. There should be no ion peaks in 4-14 and 20-25 mass units less than molecular ion. Otherwise, the maximum mass number judged is not the molecular ion peak. It's impossible to lose 4-14 hydrogen in a organic molecule. If the chain is broken, the smallest fraction lost should be ch3 and its mass is 15 mass units. Similarly, it is not possible to lose 20-25 quality units。
3. Molecular ion shall be a strange electron ion and its mass shall conform to nitrogen rules. Nitrogen rules mean that when organic compounds molecules contain odd numbers of nitrogen, their molecular mass should be odd. For even (including zero) nitrogen, the molecular weight shall be even. This is because of the odd mass of atoms with odd values and even mass of atoms with even values among the elements that make up organic compounds, the molecular mass must be even after formation of molecules. With the exception of nitrogen, which has an odd price and an even mass, molecules contain odd numbers of nitrogen, which are odd numbers and even numbers of nitrogen, which must be even numbers。
If an ion peak is fully consistent with the three principles of judgement described above, the ion summit may be a molecular ion peak; if one of the three principles is inconsistent, the ion summit is certainly not a molecular ion peak. Particular attention should be paid to the fact that some compounds are prone to m-1 or m+1 peaks and that, when molecular ion is weak, it is easy to mix with noise peaks, so that other factors, such as the origin and nature of samples, are considered in the determination of molecular ion peaks。
If it is judged that there are no molecular ion peaks or that molecular ion peaks cannot be determined, flexible ionation is required, e. G., chemical sources of ionization, field desorption sources and electrospray sources. Appropriate sources of ion are selected according to the characteristics of the sample. The flexible ion method often results in quasi-molecular ion, which then deduces the true molecular mass。
Molecular formula determination
Using the general el mass spectra is difficult to determine the molecular formula. In the early years, the isotope peak of the molecular ion peak was used to determine the molecular composition. The organic compound molecules are composed of elements c, h, o, n, most of which are isotopes, and, due to the contribution of isotopes, the mass spectra contains isotopic peaks of m+1, m+2, in addition to molecular ion peaks of m mass。
Since the composition of the elements of the different molecules and the isotope abundance of the different compounds vary, beynon has compiled the strength values of the various compounds (including the combinations of c, h, o and n) of m, m+1 and m+2 into a mass and abundance table, which can be used to determine the molecular pattern if the molecular mass of the compounds and the strength ratio of m, m+1 and m+2 are known。
For example, a compound has a molecular mass of m = 150 (100% abundance), 9. 9% abundance of m + 1, 0. 88% abundance of m + 2, and a molecular pattern of the compound. According to the beynon table, there are 29 m=150 compounds, of which c9h10o2 is consistent with the data given. This method of determining the molecular pattern requires the determination of the isotopic peak to be very accurate. And only for compounds with smaller molecular volumes and stronger molecular ion peaks, where mass maps are used, computer-based library searches generally yield better results and do not require the computation of isotope peaks and tabulations. Therefore, this checklist is no longer used。
High-resolution mass spectrometers are used to provide molecular composition. Since the atomic amounts of carbon, hydrogen, oxygen and nitrogen are 12. 000, 1. 007825, 15. 994914 and 14. 00374, respectively, it is easy for computers to calculate the number of different elements contained in the molecules of the compounds if they can be accurately measured. Currently, elements of the compound can be given by the fourier transformer mass spectrometer, the double focus mass spectrometer, flight time mass spectrometer, etc。
Identification of molecular structure
It is clear from the foregoing that the mass and strength of the ion generated by molecular ionizing of the compound are closely related to the structure of the molecule itself. In other words, the mass spectrometry of the compound has strong structural information, which can be obtained through the analysis of the mass spectrometry of the compound。
General process for spectrolysis
A mass map of a compound contains a great deal of information that can be used to determine the molecular mass, to validate a structure, to confirm the existence of an element, or to identify a completely unknown compound. The methodology and focus of the different scenarios vary. The general process of resolution of mass spectrographs is as follows:
(1) a high-quality end of the mass spectra determines the molecular ion peak, extracts the molecular mass, makes a preliminary determination of the type of compound and whether it contains elements such as ci, br, s, etc。
(2) the composition of the compound is given based on high-resolution data from molecular ion peaks。
(3) calculates the unsaturation of the compound in form, i. E. Determines the number of rings and double keys in the compound. The calculation is:
For example, insaturation of benzene
Unsaturation indicates the unsaturation of organic compounds, and calculation of unsaturation helps to judge the structure of compounds。
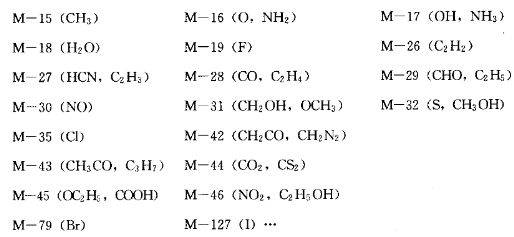
(4) study of high quality end ion peaks. The mass spectrometer's high-quality end ion peak is formed by the loss of debris in the molecular ion. From the debris lost from the molecular ion, it is possible to determine which replacement bases are present in the compound. Common loss of fragments of ion are:
(5) study low-quality end ion peaks and search for characterization ion and characterization ion series of compounds created after break-ups. For example, the characteristic ion series of n-alkanes are m/z 15, 29, 43, 57, 71, etc. And the ion series of alkanes are m/z91, 77, 65, 39, etc. The type of compound can be inferred from the characteristic ion series。
(6) the structural units of the compounds are proposed through the study of the above aspects. One or more of the most likely structures is proposed, depending on the molecular volume of the compound, the formula, the source of the sample, the physico-chemical properties, etc. Where necessary, the final results can be derived from infrared spectral and mri data。
(7) validation of results. Validation is done by dissecting the resulting structure into a mass spectrometry pattern to see whether the resulting ion is consistent with the unknown spectrograph; by checking the standard mass spectrograph of the compound to see whether it is the same as the unknown spectrograph; by looking for a sample, a mass spectrograph to make a sample, and by comparing it with the unknown spectrograph。
Examples of spectra analysis
Example 1 test mass spectrograph 1 and figure 2 for 2-pentone or 3-pentone, respectively. Draws the main ion formation process in the spectra。
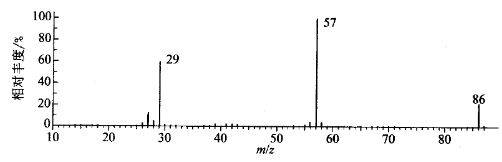
Figure 1
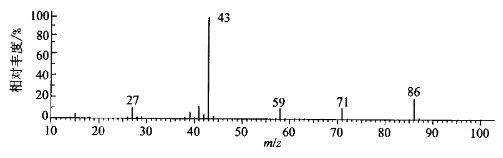
Figure 2
Figure 1: m/z 57 and m/z 29 are strong and close to abundance. M/z 86 molecular ion peak mass is 29u larger than the largest nearby debris ion m/z 57, which is reasonably lost and corresponds to the debris structure c2h5. On this basis, figure 1 is a mass spectra of 3-pentone, m/z 57 is formed by a fracture and m/z 29 by i fracture. Figure 2 shows the mass spectrometry of 2-pentone, with a base peak of m/z43 and low abundance of other ions, which results in the same mass of two ions from the a and i fractures of 2-pentone。
Example 2 the unknown material spectra is shown in figure 3 and the infrared spectrum shows that the unknown is strongly absorbed in 1150-1070 cm-1 to try to determine its structure。
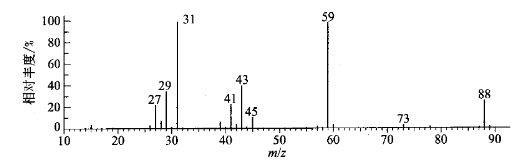
Figure 3
Solve: the following structure information can be obtained from the mass spectra:
1m/z 88 is the molecular ion peak
2m/z 88 and m/z 59 are of a quality of 29u, are reasonable losses and may be c2h5 or cho;
M/z 29, m/z 43 ion peaks in 3 spectrographs indicating the possible presence of ethyl, n-propyl or isopropyl
4 base peaks m/z 31 are characteristic ion peaks of alcohol or ether indicating that the compound may be alcohol or ether。
Since the ir spectrum is not absorbed in 1740-1720 cm-1 and 3640-3620 cm-1, the compounds can be rejected as formaldehyde and alcohol. Because m/z 31 peaks of the ether can be generated by a reordering reaction through
Based on this reaction and other mass spectrometry information, it is assumed that the unknown may be structured as
The process of producing the main ion in the mass spectrum:
Example 3 an elemental analysis of a compound measured as c8h8o2, with a mass map shown in figure 4 to determine the compound structure。
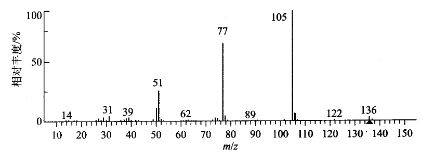
The compound molecular mass m = 136. Insaturation of the compound
U=8-8/2+0/2+1=5
Since the saturation is 5 and the mass spectra has peaks m/z 77, 39, 51, it can be inferred that the compound contains benzene rings。
High-quality end mass spectrometer m/z 105 was generated by fragments (-ch2oh or-och3) of 31 mass of m/z 77 (benzene) of 28 mass (-co or-c2h4) of m/z 105. Because the mass spectra does not contain m/z 91 ion, m/z 77 corresponds to 105 lost co, not 105 lost c2h4。
It follows that the structure of the compound is as follows:
The standard maps for each of the two compounds are shown in figures 5 and 6。
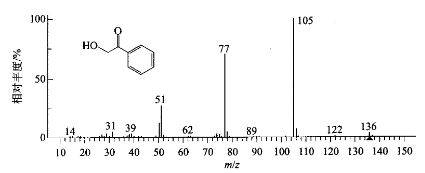
Figure 5 standard mass spectrometry of 1-phenyl-2-hydroxyethylene figure
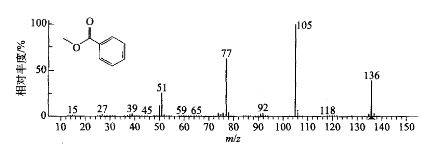
Figure 6 figure
Example 4 an unknown substance profile is shown in figure 7, which attempts to determine its structure。
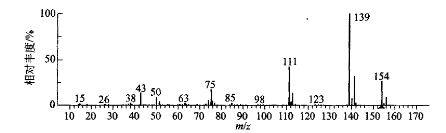
Figure 7
The mass spectra determines the molecular mass of the compound m = 154. M/z 156 is an isotope peak of m/z154。
The ratio of m/z 154 and m/z 156 is approximately 3:1 and it can be assumed that the compound contains a cl atom。
M/z 154 lost 15 mass units (ch3) m/z 139 ions。
M/z 139 lost 28 mass units (co, c2h4) m/z 111 ions。
M/z 77, m/z 76, m/z 51 are characteristic ion of benzene rings。
M/z 43 may be -c3h7 or -coch3-generated ion。
As can be seen from the above analysis, the structural units in which the compound exists may:
Based on mass maps and chemical reasonableness, the possible structure of the unknown is:
Of the three structures mentioned above, a strong m/z 125 ion is necessarily present in the mass spectra, which is not consistent with the map given; in the case of (c), the compound should also have m/z 125 ions according to the general pattern, although the strength of the ion is low, so it is less likely; in the case of (a), the fracture is fully consistent with the spectra。
Two structural formulas, (a) and (c), may be given if only a mass spectrograph interpretation is relied upon. It is then further judged by:
1 standard mass spectra for (a) and (c) (figures 8, 9). Look which is the same as the unknown。
2 see which spectra is the same as the unknown spectrograph using the label to do the same mass spectrograph。
3 using ms-ms combined techniques, determine ion interrelationships, further analyse spectrographs and finalize the unknown structure。
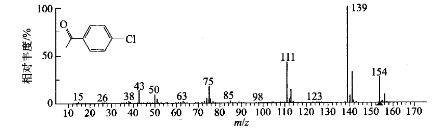
Figure 8
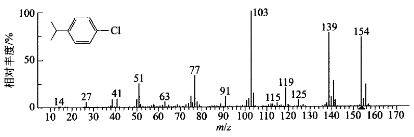
Figure 9
“mass spectrometry” is a mass spectrometry, and most experiments do not use mass spectrometry alone, but gas chromatography-mass spectrometry (hereinafter gc-ms). In short, complex mixtures are separated into relatively simple components through the gas chromatography, each of which is charged separately by ionization and displays different mass/charge ratios on mass spectrometry because of their different mass. As some of the chemical keys may break during ionization, different chemical structures tend to present different mass spectrographs that allow qualitative detection of the substance by matching。