The level-2 scenario provides deeper and faster market data than usual and allows for a clearer insight into financial movements. The table below summarizes its core functions and viewing techniques。
Function module
What is it
Where to look
Core disk techniques
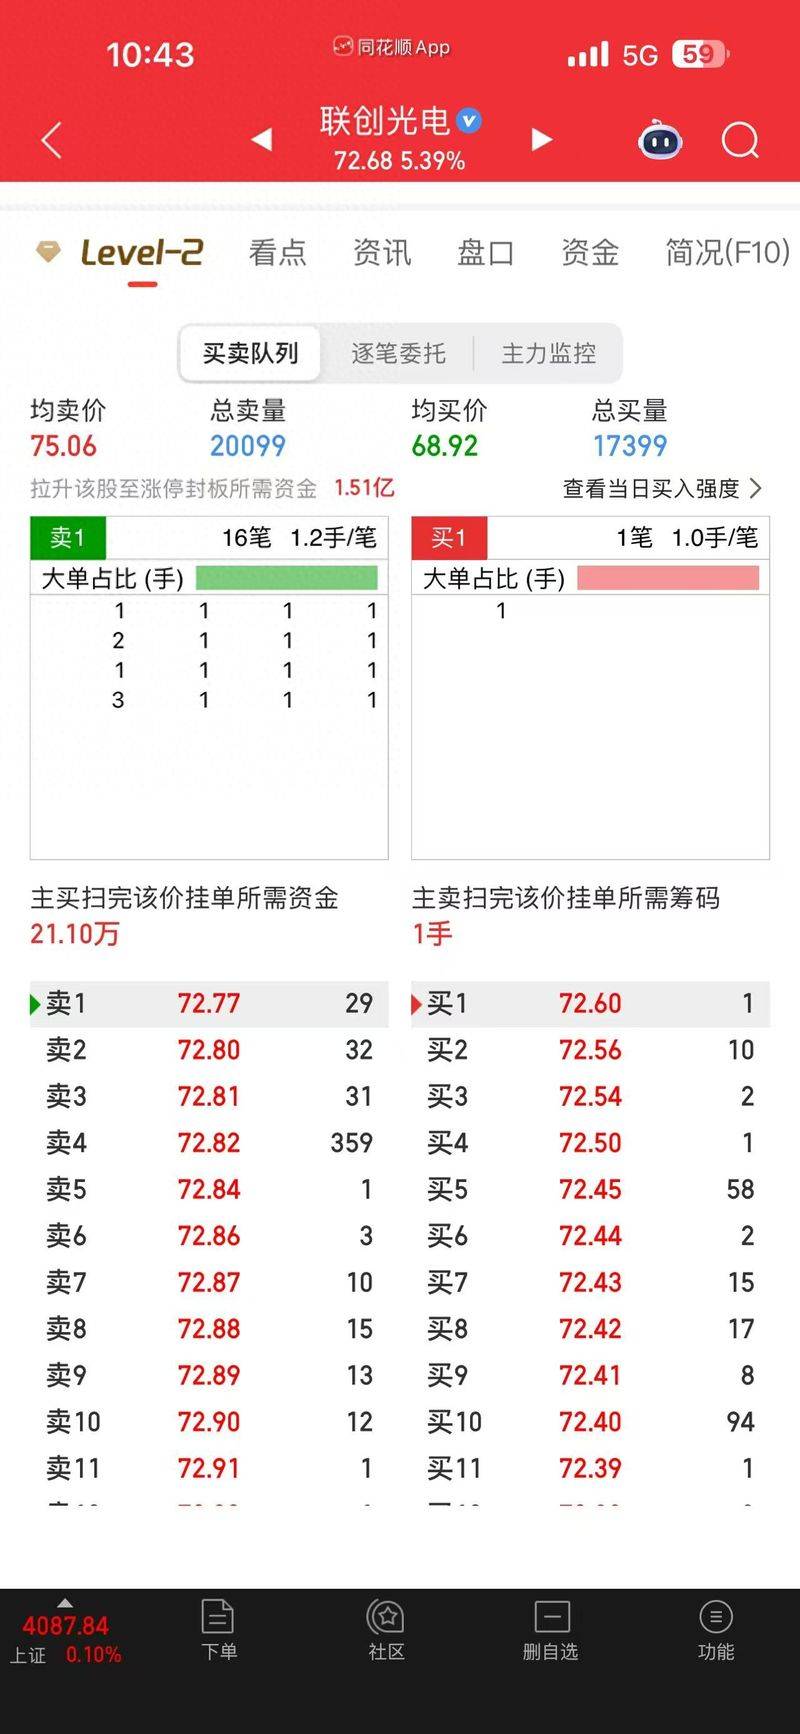
The 10th
Shows a list of the orders to buy ten, sell ten
Table area for a stockline page
Identification of support/pressure levels: observe any large monolithic accumulations in the purchase/sale of ten。
Perception: a “fishing bill” to guard against a non-purchase/sale location and disappears may be more attractive。
Deal
Accurate recording of the details of each transaction (time, price, volume, direction of sale)
"detailed" or "more" below the level
Following the main thrust: screening of large bills/extreme bills, combined with the direction of active purchases (red for active purchases, green for active sales) and judging the true intent of the main forces。
Entrust queue
Show me how you lined up for all the hang-ups on one/sale
Click to view in the area (usually right-click or specific entry)
Adjudication of the authenticity of the list: if the first order of the price is always a small one, the sudden emergence of a large volume of active sales may support vulnerability; conversely, the code of large numbers is solid。
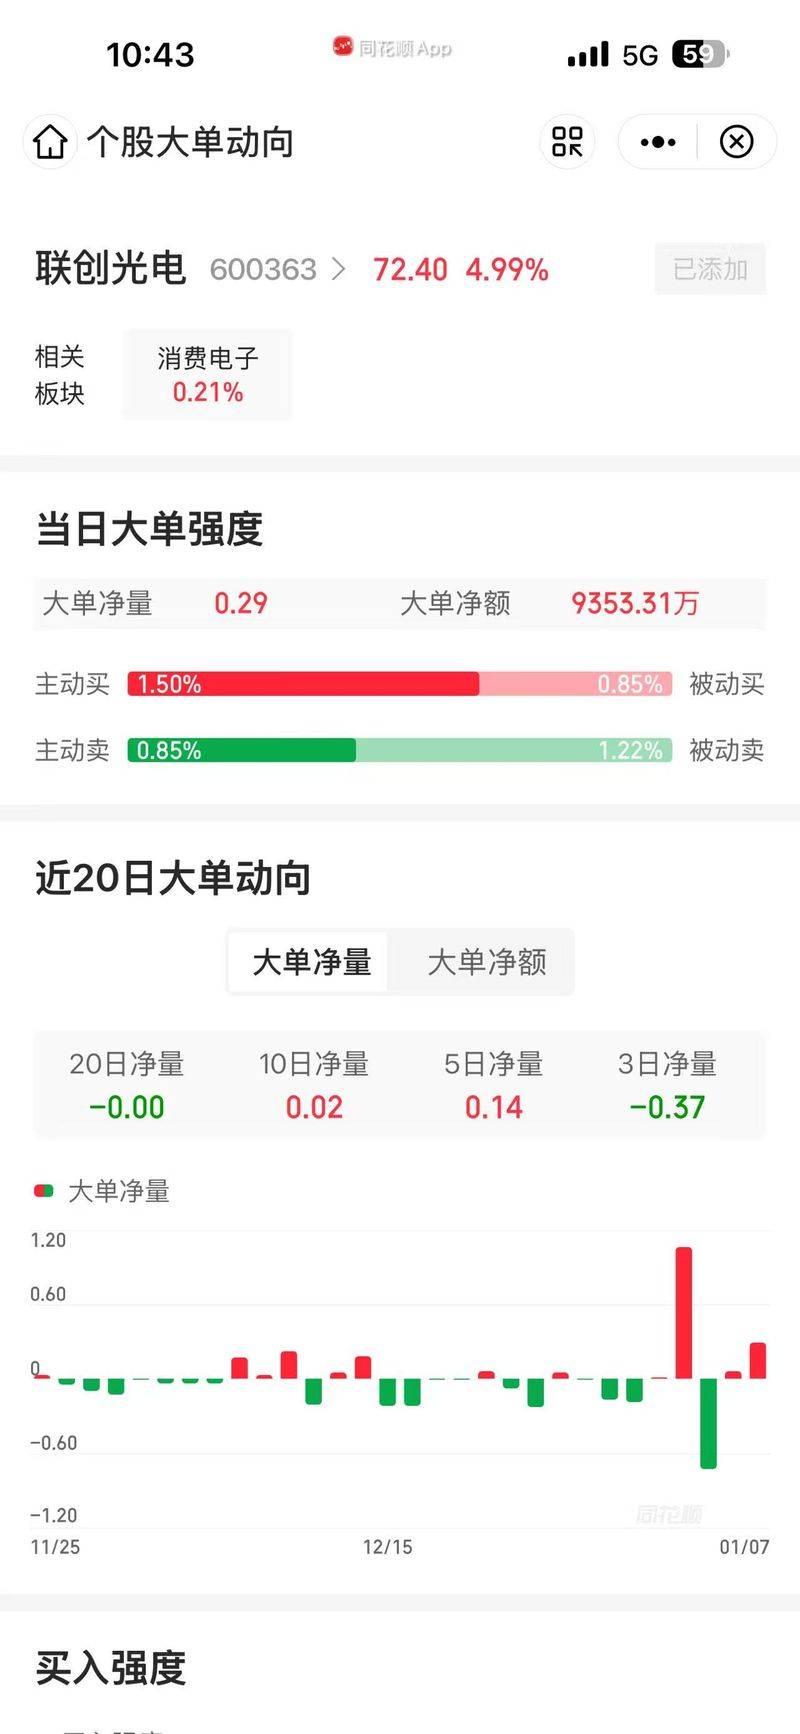
Flow of funds to functions (e. G. Dldd decision-making)
Data-by-data basis for net inflow/outflow of large, medium and small sheets
"level-2 " menu or feature indicator bar in software, such as "dde decision-making system"
Hotspot units/boards were found: large net and large amounts per unit or block continued to be positive, indicating a major inflow of funds. At the same time, concern is expressed at the decline in the number of bulk households indicator, which indicates a concentration of chips。
Use recommendations