Real estate is fast
1) new deal performance observation in shanghai: a barter with an area in excess of the first three rounds
As part of a 24-year-long process of easing purchases within the outer ring, shanghai, 25 february 2026 (first nine), the effects of the policy can be compared at three dimensions:
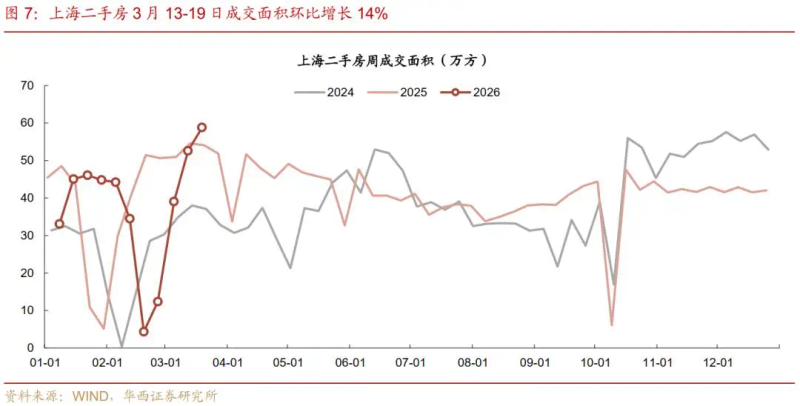
First dimension, longitudinal comparison of historical data in shanghai. Second-hand house transactions on 26 february-19 march 26, i. E., 22 days after the policy was completed, show a small decline of 5 per cent over the same period of 25 years, but a significant increase of 42 per cent over the same period of 24 years, with a clear impact on demand activation. In terms of weekly changes, shanghai has seen an increase of 14 per cent in the ring area over the last week, and a 33 per cent increase in the previous week, which is still in the uphill slope. Using the spring festival as a benchmark to observe sales from the twenty-fifth to the beginning of february, compared to the same period last year, shanghai grew by 10 per cent over the same period, beijing by 1 per cent and shenzhen by 2 per cent. The previous week saw 26 per cent growth in shanghai, 7 per cent growth in beijing, a 9 per cent decline in shenzhen and a widening gap between shanghai and other cities。
The second dimension, comparing the four rounds of policy stimulus over the past 24 years, shows that after the 25 february 26 stimulus, the absolute volume of the third week of trade area has exceeded the previous three rounds. Since august 25 was the weakest of the four rounds of policy, it was possible to compare the 26 february and 24 years of policy. Since the policy came out in february 26, three weeks have now passed since the date of the agreement, the third week has reached an area of 83,000 square kilometres, which is higher than the 24-year average of 74-799 square kilometres, which is 5-12 per cent better than the 24-year policy. Compared to the previous week of the policy, the cut-off of the spring festival resulted in a 50 per cent increase in the area on the third week of the current round, which was approximately 24 years in may (49 per cent) and less than september 24 years (55 per cent)。
The third dimension, compared to the undeveloped policies of beijing and shenzhen, in order to eliminate the effects of the spring festival, compares the dates of 26 february to 19 march 26 and 7 to 28 february 25, to 22 days after the spring festival. Shanghai is clearly better than other cities, with an increase of 20 per cent in shanghai, compared to 4 per cent in beijing and 4 per cent in shenzhen。
The duration of the subsequent heat is of concern, referring to the past, after relaxing in may and september 24, the weekly barter peaked at 4 weeks and 10 weeks of shock growth, respectively, followed by another weakening of the barter. After the policy came out, it coincided with the “golden four” sales season, which, after the season, may have led to a reversal due to the “mountiary overdraft”。
2) housing price observation: weekly second-hand house prices in shanghai have increased slightly, while other cities continue to fall
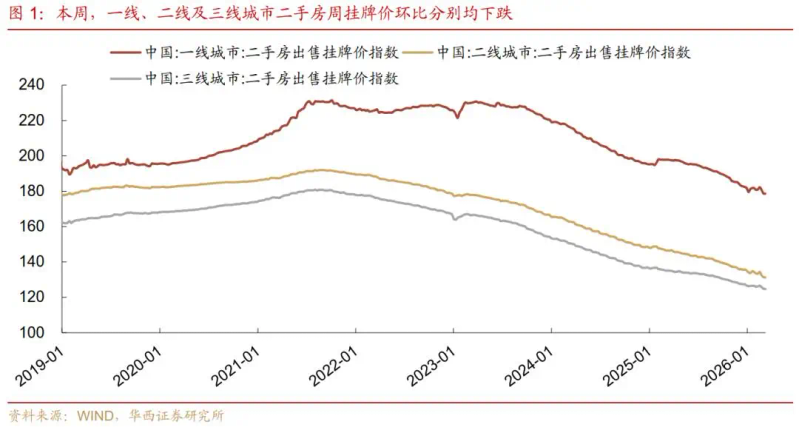
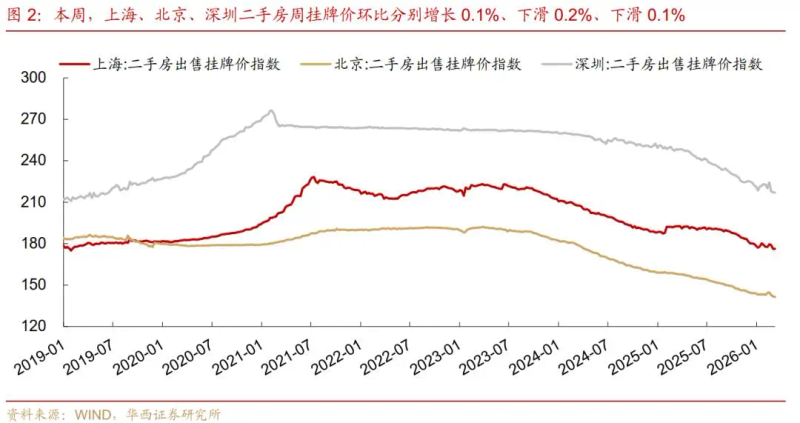
From 9 to 13 march, the prices of second-hand houses in the first-line cities were divided, with the shanghai ring rising by 0. 1 per cent, while the beijing shenzhen ring fell by 0. 2 per cent and 0. 1 per cent, respectively. The two-and-three-line urban ring ratio also declined, with a decline of 0. 1 per cent. For a long time, after a rise and fall at the end of 25, second-hand house prices fell again by 1 to 3 per cent in each of the cities, 1. 8 per cent in the first-line cities and 2. 9 per cent and 1. 5 per cent in the second-line and third-line cities, respectively。
3) monthly trends show that the market as a whole remained cold during the “golden-silver-silver-silver” period
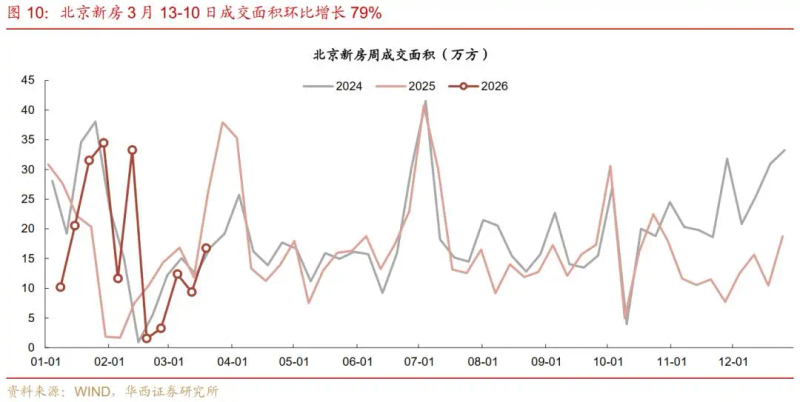
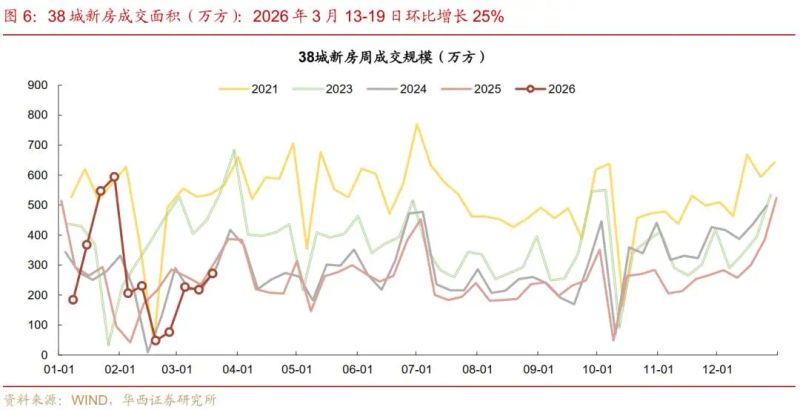
With the boosting effect of key cities, the weekly round-trip ratio of the city has improved, although the downward trend has remained unchanged. With regard to second-hand houses, the trade-rate ratio improved in kyoku, hangzhou and suzhou, resulting in a 15 per cent increase in the area of 15 urban second-hand houses, which remained at 7 per cent for the same week, down from 13 per cent last week. The new ring is better than the second-hand room, with higher increases in hangzhou, chengdu, beijing and shenzhen, with 25 per cent growth in the new ring and a drop of 8 per cent over the same period, almost the same week before。
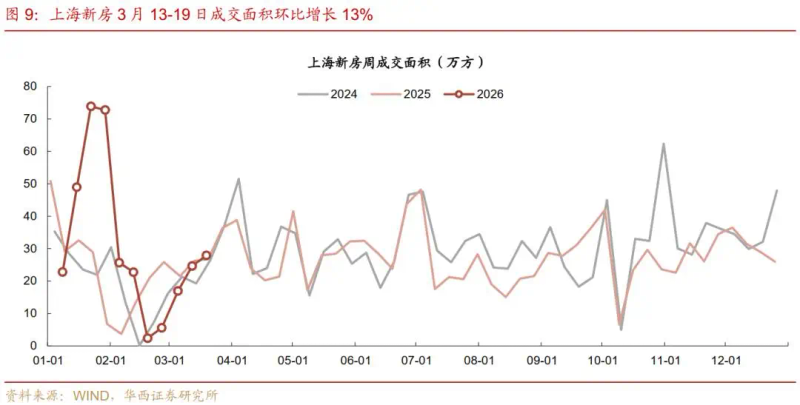
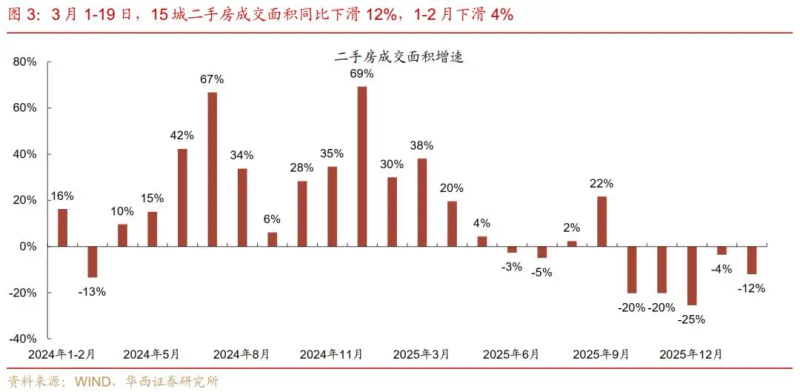
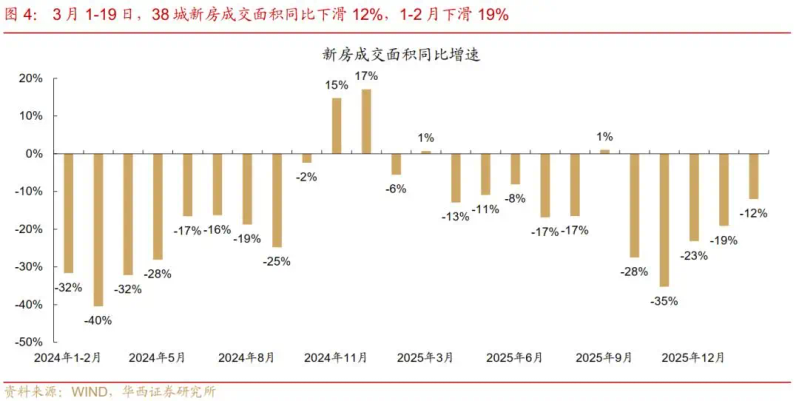
The monthly trend shows that, although during the “golder four” period, the overall temperature trend remained unchanged, with a 12 per cent decrease in the area closed in used rooms from 1 to 19 march compared to the same period in 2025, a decrease of 9 percentage points compared to the previous month and an increase of 9 percentage points, with new houses falling in january-february, a 19 per cent decline compared to january-february and a 12 per cent decline from 1 to 19 march。
In terms of structure, most cities in the used house market declined from 1 to 19 march, with a relatively high decline in shenzhen, hangzhou, suzhou and dalian. In the new housing market, shanghai, wuhan and xenmen have seen a similar increase, while shenzhen and some of its second- and third-line cities have seen a larger decline。
Major urban observation