Iailure
Rale
Infant
Morlalitv
Region
Steady
Stale
Region
I'm sorry
[tpm] device manages tub curves
Discrepancies vary over time, and equipment reliability parameters are estimated depending on the type of distribution, with reasonable monitoring
Methods of measurement and maintenance guidelines。
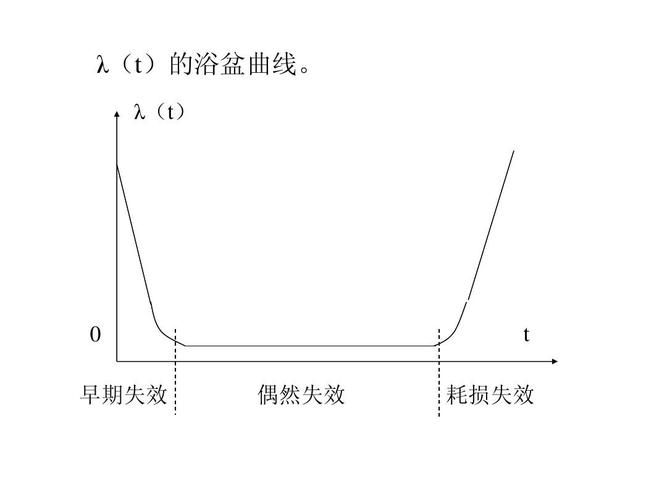
Typical malfunction curve
Complex systems, equipment consisting of many different parts, with changes in failure rates over the life cycle like
Figure。
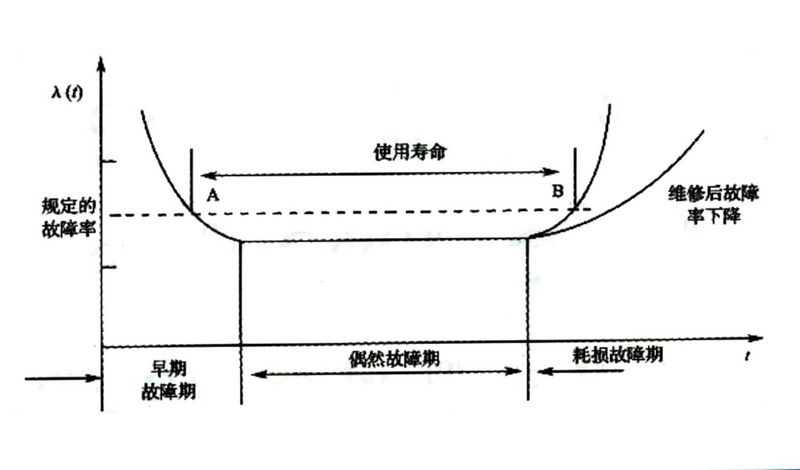
Because it looks like a tub, it's usually called a tub curve. The curve is that the device developed during its operational life
The pattern of the failure rate shows three stages of change。
The first stage is the initial period of failure, also known as the early period of failure. It refers to the installation of new equipment (or substantially repaired equipment)
The trial process goes through the pilot phase of the handover of production。
Quality of parts processed and not fully mastered by operational workers due to design, manufacturing deficiencies, etc. Original
As a result, the period was characterized by more malfunctions and problems were fully exposed. As debugging and troubleshooting takes place, equipment becomes operational
Normal, the incidence of malfunctions has gradually decreased。
The second stage is an occasional failure period. At this point, the equipment's motors are in normal wear and tear, and the operator's got it
The features of the performance, rationale and adjustments of the equipment have been significantly reduced, and the equipment has entered the operational phase。
Failures at this stage are generally due to inadequate maintenance of equipment, improper use, working conditions (load, temperature
Due to, inter alia, deterioration of materials, failure of control, inadequate structure, etc
Problems。
The third stage is a poor performance period, also known as a rundown period. Parts of the equipment are worn out over the longer period of time
Growing erosion, fatigue, ageing of materials, etc., and their failure to function, resulting in more equipment failure and reduced productivity, to the exclusion
The duration of the barrier and the difficulty of troubleshooting have gradually increased, and maintenance costs have increased。
This should take different forms of overhaul or technical adaptation to restore productivity. If you keep using it, you can
It can cause accidents。
Three basic types of fault distribution that correspond to the above three phases, i. E., the initial failure-reducing pattern, and the occasional onset pattern
The period of depletion is an incremental breakdown. Faults occurring in three phases, if due to wear and tear, are called regular malfunctions。
The corresponding wear and tear in the three phases may therefore also be divided into wear and tear periods, slow wear and rapid wear and tear。
2 fault model of complex equipment
In the 1960s, the theory of reliability-centred maintenance was introduced, after extensive research, in response to the
In addition to the tub curve failure model, five other failure models exist, as shown in the figure。
Five fault curves show the relationship between failure and time of various electrical components, of which the probability of failure is stable or slow
The three types of increase d, e and f account for 89 per cent of the total probability of failure, while the remainder account for only 11 per cent。
Dalanik law: "recoverable complex equipment, regardless of the type of failure item lifetime distribution, which is repaired or updated
After that, the failure rate of the equipment is constant over time."
The failure patterns of complex equipment vary, with each failure occurring randomly and if the failure is removed, repaired or updated in a timely manner
This makes the failure rate constant. Except for simple wear and tear, fatigue and corrosive failure, it is a, b, c
Type failure。
Ka
7%
I--
14%
"d" goes from slow to slow."
E failure index distributionl'
The more complex the equipment, the higher the failure rate and the greater the randomity, according to the different fault distribution curves in the figure. Just some kind of static surveillance
Diagnostic methods and maintenance methods make it difficult to resolve complex equipment failures。
Nasa studies the probability of six equipment malfunctions, 68 per cent of which are f, for the duration of service. Internal
The probability of failure is constant。
Complex equipment means equipment with multiple failure patterns, general mechanical equipment, electrical and electronic set
Most of the equipment is complex, such as electrics, motors, processing centres, compressors and production lines. The broken foundations of these devices
The pattern of f-type failure was consistent and constant during service, but the failure occurred at random。
It is therefore important to emphasize that monitoring and diagnosis of equipment is the more random the failure of the equipment is, the more it is tested and diagnosed. Device testing
The diagnosis consists of equipment outages to detect diagnostics and those in operation, as well as online monitoring and offline monitoring diagnostics。
3 malfunction gradients
The barrier
"f" is slow
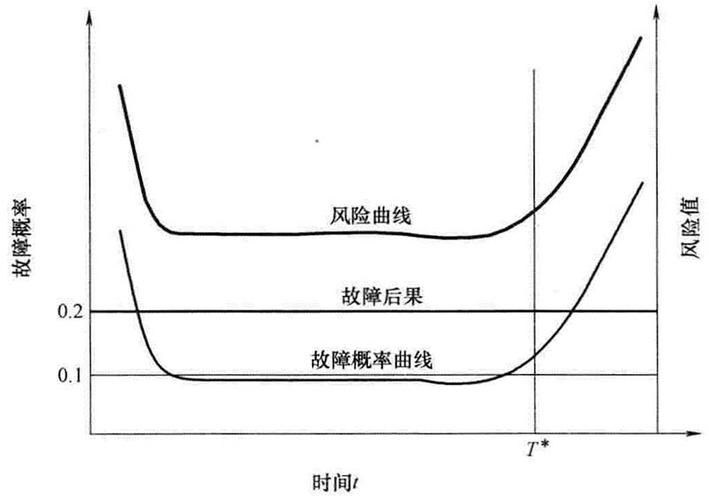
Equipment performance is a gradual process that begins to deteriorate and enters a potential failure period, stating that the equipment is from a potential failure
The interval between functional failure to u is p-f, as shown in the figure
I'd like to hear from p-f bien
4. Gravity of equipment performance
The poor performance of the equipment is also a process from quantity to quality, and its development process is as planned icon
5 structure of causes of deterioration
The poor performance of equipment may be due to a single, multiple or compound factor, the structure of which is shown in the figure。
The second reason for the poor performance of the equipment is the single platinum, multifactor or regenerative structure t, as shown in the figure
Reason 2
Structure park
Single factor
Winter factor z
The compound factor
♪ the queen ♪