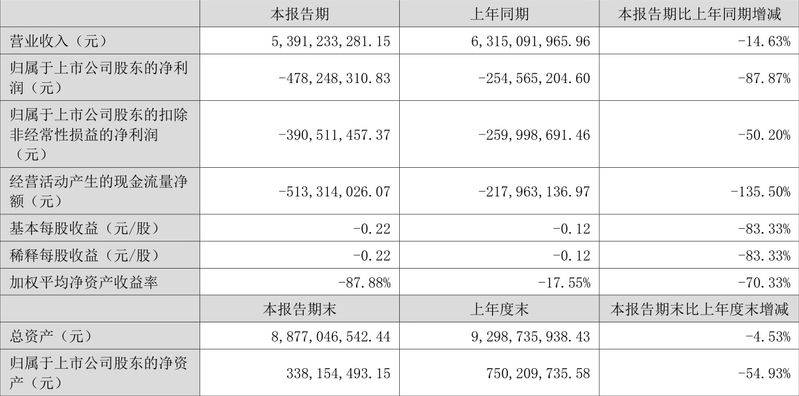
Contact interaction (002280), 31 august, disclosed semi-annual 2023. In the first half of 2023, the company achieved a total operating income of $5,391 million, a decrease of 14. 63 per cent over the same period; a loss of $478 million in net profits attributable to the mother and a loss of $255 million in the same period of the previous year; a loss of $391 million in net non-profit losses and a loss of $260 million in the same period of the previous year; a net cash flow from operating activities of $513 million, compared to $218 million in the same period of the previous year; and, during the reporting period, the average weighted net asset gain per share of communications was - 0. 22 per share。
At the closing price on 30 august, the current ratio of market earnings (ttm) to liaison interactions is approximately 5. 69 times, the net market rate (lf) is about 19. 51 times and the market rate (ttm) is about 0. 57。
The historical distribution of the company's earnings (ttm), net market share (lf) and market share (ttm) in recent years is as follows:
According to the semi-annual report, the company achieved gross operating income of rmb 2. 470 billion in the second quarter, a decrease of 12. 79 per cent in comparison with the same year, and a decrease of 15. 46 per cent in the ring ratio; net profit of rmb 3,665 million in the mother's return, a decrease of 1047. 28 per cent in comparison with the same year, a decrease of 223. 82 per cent in the ring ratio; and the deduction of non-net profit - rmb 204 million, a decrease of 27. 11 per cent in comparison with the same year and a decrease of 9. 65 per cent in the ring ratio。
The information shows that the company is centred on cross-border electric operators and trade distributions, with a multi-layered and diversified business system, such as collective advertising, visualization and internet finance。
In terms of subproducts, in the first half of 2023, electricity producers received $5. 05 billion, a decrease of 13. 30 per cent over the same period, representing 92. 84 per cent of operating income, and cultural media received $364 million, a decrease of 29. 64 per cent over the same period, or 6. 76 per cent of operating income。
In the first half of 2023, the company's māori ratio was 9. 06 per cent, a decrease of 3. 81 percentage points over the same period; the net interest rate was 12. 43 per cent, a decrease of 7. 02 percentage points over the same period of the previous year. In terms of single-quarter indicators, in the second quarter of 2023, the company's māori rate was 9. 09 per cent, a decrease of 3. 34 percentage points and an increase of 0. 06 percentage points in ring terms; net interest rates were 18. 78 per cent, a decrease of 18. 20 percentage points and a decrease of 11. 72 percentage points in comparison with the previous quarter。
For sub-products, the māori ratio for the first half of 2023 was 11. 39 per cent and 22. 72 per cent, respectively。
The data show a weighted average net asset return of -87. 88 per cent in the first half of 2023, a decrease of 70. 33 percentage points compared to the same period in the previous year, and a return of 10. 22 per cent in the first half of 2023, a decrease of 5. 90 percentage points compared to the same period in the previous year。
In the first half of 2023, net cash flows from corporate operations amounted to $513 million, a decrease of $295 million over the same period; net cash flows from fund-raising activities amounted to $72. 897 million, an increase of $328 million over the same period; and net cash flows from investment activities amounted to $176 million, compared with $510 million during the same period the previous year。
Further statistics show that corporate free cash flows in the first half of 2023 amounted to $824 million, compared with $246 million in the same period the previous year。
In the first half of 2023, the cash ratio of company operating income was 111. 42 per cent。
In the first half of 2023, the company spent 1,066 million yuan during the period, a decrease of 109 million yuan over the same period of the previous year; however, the rate was 19. 78 per cent, an increase of 1. 17 percentage points over the same period of the previous year. Of these, sales costs decreased by 15. 36 per cent over the same period, management costs decreased by 0. 76 per cent over the same period, r & d costs decreased by 17. 41 per cent over the same period and financial costs increased by 2. 2 per cent over the same period。
In terms of significant asset changes, by the end of the second quarter of 2023, the company's monetary fund balance had decreased by 49. 30 per cent compared with the end of the previous year, or 6. 06 percentage points as a share of the company's total assets; accounts receivable had decreased by 29. 41 per cent compared with the end of the previous year, or 2. 27 percentage points as a share of the company's total assets; fixed assets had increased by 31. 79 per cent compared with the end of the previous year, or 1. 87 percentage points as a share of the company's total assets; and inventory balances had decreased by 8. 37 per cent compared with the end of the previous year, or 0. 47 percentage points as a share of the company's total assets。
In terms of significant changes in liabilities, by the end of the second quarter of 2023, the company's accounts payable had decreased by 27. 73 per cent compared with the end of the previous year and by 4. 41 percentage points as a share of the company's total assets; short-term borrowing had increased by 15. 09 per cent compared with the end of the previous year, representing an increase of 2. 41 percentage points as a share of the company's total assets; contractual liabilities had decreased by 41. 22 per cent compared with the end of the previous year, representing a decrease of 1. 00 percentage points as a share of the company's total assets; and non-current liabilities maturing in one year had decreased by 1. 57 per cent compared with the end of the previous year, representing an increase of 0. 75 percentage points as a share of the company's total assets。
In terms of inventory movements, the carrying value of the company's inventory at the end of the first half of 2023 was $996 million, or 294. 48 per cent of net assets, representing a decrease of $9. 0161 million compared with the end of the previous year. Of this amount, $4,23489 was prepared for stock price reductions, or 4. 08 per cent。
At the end of the first half of 2023, the goodwill of contacts reached $634 million, equivalent to 187. 62 per cent of the company's net assets of $338 million over the same period。
With regard to solvency, the company's asset liability rate at the end of the second quarter of 2023 was 92. 11 per cent, an increase of 5. 31 percentage points compared with the end of the previous year; the interest-bearing asset liability rate was 38. 88 per cent, an increase of 3. 15 percentage points compared with the end of the previous year。
In the first half of 2023, the corporate mobility ratio was 0. 63 and the speed ratio was 0. 45。
According to the biannual report, among the top 10 active shareholders of companies at the end of the first half of 2023, the new shareholders were hong kong central clearing co. Ltd., liu chang yu, replacing schechen, yuki and private investment funds no. 2 at the end of the quarter. In terms of the specific shareholding ratio, the shares of ningbo, chen jianli and kian ying have declined。
Shareholders ' names as shares (in 10,000 shares) as percentage of total equity (%)
Wang zhi
It's just a matter of time
4. 113962
No change
Ho shito
720. 8. 21
3. 310849
No change
Shenzhen's merger and purchase partnership (limited partnership)
6676. 7
3. 066715
No change
Rock 'n 'em made private securities investment fund no. 1
2981. 15
1. 36929
No change
Hong kong central settlement ltd
2128. 15
0. 97794
New
Ningbo
2008
0. 92207
- 0. 03
Chen li
1579. 61
0. 725542
- 0. 00
Liu chang yu
1148. 81
0. 527667
New
Shun-sun
1107. 61
0. 508741
No change
Money
1090. 01
0. 50659
- 0. 00
It is noteworthy that, according to semi-annual reporting data, 13. 38 per cent of the shares of the liaison interactions were pledged. Of these, the first largest shareholder, ho chito, pledged 288 million shares in the company, representing 99. 72 per cent of its total holdings。
In terms of leverage concentration, by the end of the second quarter of 2023 the total number of company shareholders stood at 1159 million, a decrease of 213,000, or 15. 50 per cent, compared with the end of the quarter; the market value of the share held by households fell from $6. 62 million at the end of the quarter to $6. 14 million, or 7. 25 per cent。
Indicator note:
Market surplus = total market value/net profit. When the market surplus is negative when the company loses, the valuation of the market surplus is not meaningful and is often used as a reference for net market rates or sales rates。
Net market rate = total market value/net assets. The net market rate valuation method is used mostly for companies with high profit volatility and relatively stable net assets。
Market sales = total market value/business income. Market sales valuation methods are usually used for growth-oriented companies that are in deficit or micro-interest。
The market gain and marketing rates in the text are calculated using ttm, i. E., data for 12 months up to and including the latest financial report. The net market rate is calculated using the lf method, i. E. The latest financial reporting data。
When the market surplus is negative, the current fraction is not shown, resulting in a break in the contour chart。