A few days ago, we talked to colleagues in the garment industry about the annual business analysis of the financial statements, and we all had a headache. In fact, a management analysis of clothing commodities can capture these points。
Today i'm going to talk to you about clothing business analysis, in conjunction with the annual business analysis of women's corporate financials, the comparison of annual financial data, and the three core dimensions of "the field" of "the people." it's all real dry stuff。
It is hereby stated that the case was produced by the [gau meihua] and participated in the 2025 bi data analysis competition and achieved excellent results, and that the analysis and methodology of the case merit learning and learning。
I. Overall year-by-year data comparison, starting with business trends
For an annual analysis, the first step is to look at a comparison of the overall data for the two-year fiscal year, with the focus on fast-tracking of the overall changes in the enterprise's operations, identifying the reasons for the increase or decline in performance and the direction of the problem, and analysing three dimensions:
1. Horizontal comparison of core indicators: the overall business dynamic is judged by the evolution of the current year and the last year by drawing out indicators such as sales orders, sales volumes, sales volumes, average discounts, and associated rates。
For example, the decline in the volume of sales, the decline in the number of sales units, the decline in discounts and the decline in the associated rate are signs of a weakening of overall operations。
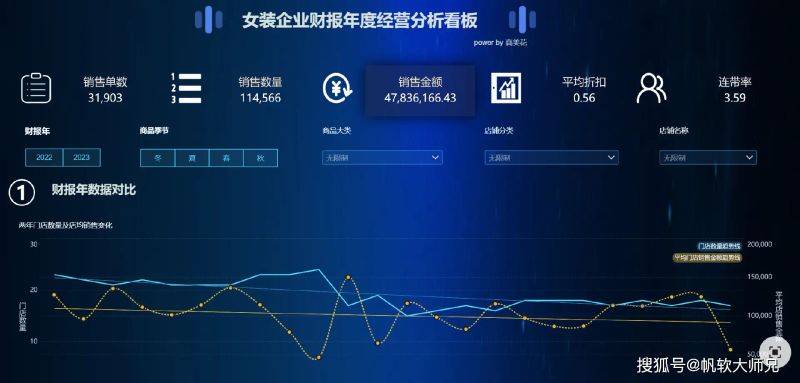
2 monthly data splits: a change in the number, quantity and amount of sales per month over the same period is found in the variable month。
For example, in which months performance has increased and in which months there has been a steady decline, a targeted analysis of the market environment, shop operations and commodity strategies of that month。
3. Analysis of store and product contributions: a diagnosis of the core impact factors of fluctuations in performance and a focus for subsequent fine-tuning analysis。
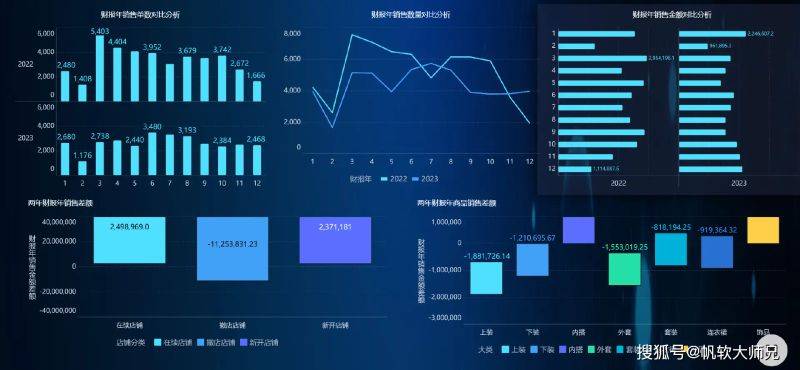
To put it bluntly, the core of the overall data comparison is to figure out the broad direction of the business and avoid subsequent analysis not being focused。
“cargo”: commodity analysis, finding business issues for core products
The product of the women's assembly industry is at its core, and good and bad performance is essentially a matter of commodity selection, layout, inventory management. I will dismantle it from three levels and analyse the whole dimensions of commodity operations:
1. Analysis of the ratio of goods to goods: a comparison of the two-year fiscal year commodity season (spring, summer, autumn and winter), changes in the share of the sale of commodities in large categories (uploading, bottoming, coatings, skirts, etc.), depending on which seasons and categories of sales contributions have declined, whether the double disk is due to insufficient orders, mismatches over new times, and unreasonable distribution of stocks
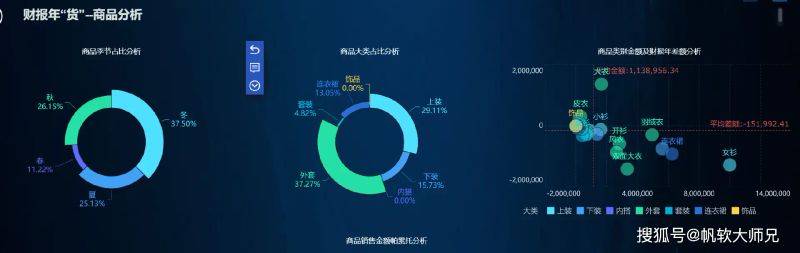
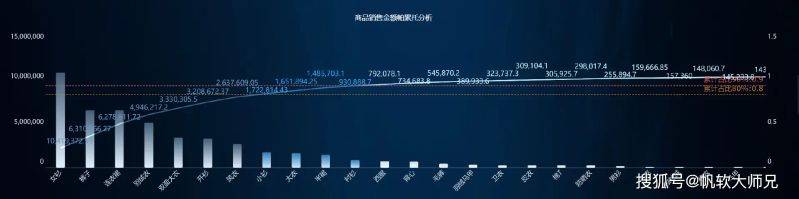
The paretto analysis validates the 28th law: analyses the paretto ratio of sales of goods, and identifies core categories that contribute 80% of sales, which are the backbone of the enterprise's profits, with a follow-up focus on stock replenishment, order volume and new rhythms。
For items with a low percentage of sales and a declining performance, the next order was made in a timely manner to avoid backlogs。
Analysis of core subdivision indicators: focus on specific subdivisions, analyse changes in sales volume, amount, unit price, associated rate, average discount over the same period, and identify reasons for fluctuations in the performance of the product. For example:
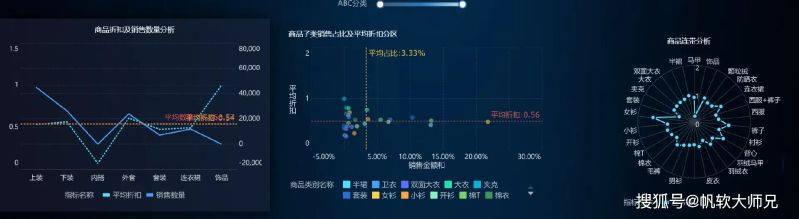
4. Analysis of the ratio of goods associated with each other: attention is paid to the combination effects of different kinds of goods, such as a high ratio of dress and ornamentals, which can guide shops in combination displays, promotions by the main sellers, and an increase in the overall unit price of customers。
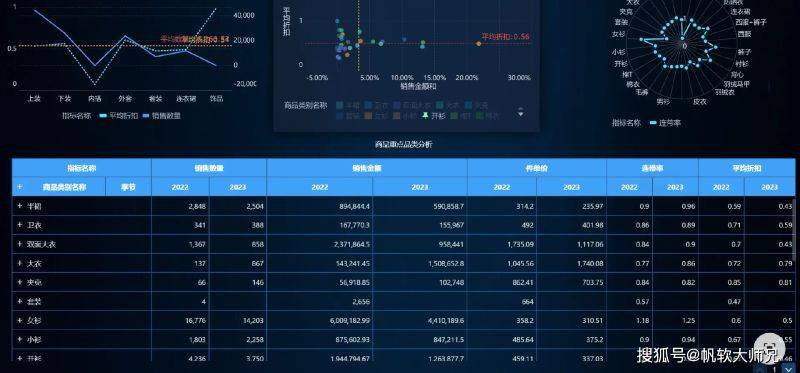
To tell you with experience, the core of commodity analysis is to figure out “why good and bad sells” and to place the results in order, new and stock management。
“scene”: shop analysis, precise targeting of business differences between different stores
The shop is a performing receiver, with different locations, customers and operating abilities, with significant differences in performance, and the analysis centred on replicable experience in finding excellent shops, short boards for finding problematic stores, at three points:
1. Analysis of the contribution of store-type sales: indicators comparing the number of sales, the amount, the unit price and the associated rate of the renewal, the divestment and the opening of three new stores. Like what
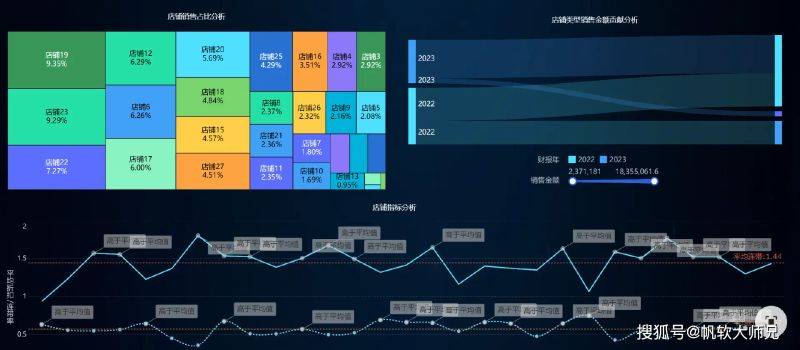
2. Analysis of the ratio of single-store sales to indicators: looking at which shops are the head of performance and which are the bottom, while comparing the average discounts and associated rates of each store to the advantages of the head shop, such as the fact that some of the shops are connected at a much higher rate than the average, and organizing their sales and displaying techniques are promoted throughout the company。
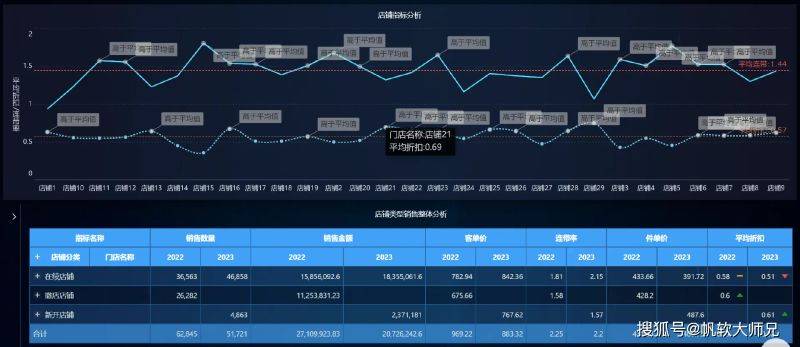
3. Analysis of changes in the performance of single-shops over the same period: looking at the same rise and decline in the performance of individual shops, a targeted analysis of the downsliding shops in terms of commercial flows, operations, inventory of goods, and the identification of the core causes, such as a reduction in the flow of people, insufficient procurement capacity, lack of inventory, etc。
I have always stressed the need for shop analysis to develop an exclusive business strategy for different types of shops with different performances, to make better and problem shops better。
“people”: staff analysis, tapping the marketing potential of direct purchases
The sale of clothing is a heavy labour industry whose ability to direct purchases has a direct impact on the performance of the shop. The analysis focuses on the identification of individual performance, the identification of sales poles and the filling of panels, which stimulate the overall potential of the team, with two dimensions:
1. Analysis of the top ranking of the core employee indicator: focus on top 10 leading purchases with a focus on the three indicators of sales value, associated rate, average discount, not a single amount of sales, a high associated ratio indicates a high combination of recommendability, a high average discount indicates a high bargaining power and a high sales capacity for high end products, all of which are sales poles of different dimensions。
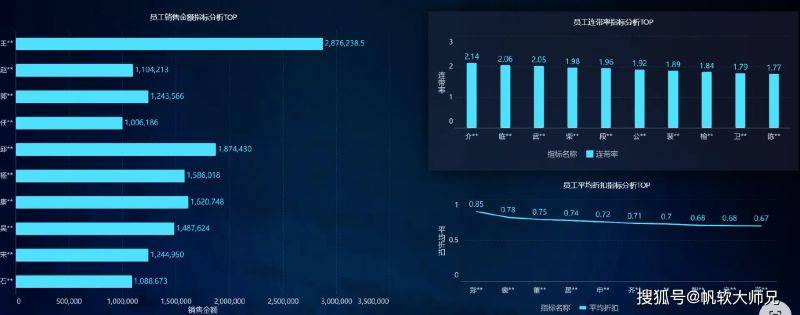
2. Lead procurement experience and short-board procurement coaching
V. Development of business plans for the following year, based on analysis
An annual business analysis is not intended to complete the report, but rather to guide the follow-up, and once historical data have been analysed, the business plan for the next financial year must be developed in the context of the actual business situation, with the results of the analysis set out in four categories:
1. Targets for the rate of depletion of goods: specific targets for sales of goods of various seasons, taking into account the characteristics of the garment industry and the enterprise's past data, to identify new times for each product category and to plan the rate of depletion per month to advance the pace
2. Commodity sales objectives: specific sales target for each continuing and new shop, based on stock of goods, historical sales outages and sales outlet targets, aggregated into corporate objectives to ensure realistic and achievable targets
Operating kpi objectives: to set targets such as average discounts, unit prices, a combination of “sale amount = volume of sales x unit price” formulas, to set the overall sales value target of the enterprise, and to achieve a growth in performance by way of a bill of lading price, subject to guaranteed profits
4. Monthly dismantling targets: disaggregation of annual targets to each month, establishment of monthly sales levels, quantity, turnover rates, monthly follow-up and reset, timely adjustment of goods, stores and personnel strategies if actual performance deviates from targets。
And finally
The analysis of the annual operations of women's companies is less complex, and the data are broken down and broken down around the overall trends of the financial year, as well as the product, field and human framework, to identify the core problems of the operation and the best experiences, and to take the results of the analysis to the next year's business planning。
It is hoped that today's sharing will give some inspiration to friends who are doing business analysis of clothing, and that you will be welcome to share practical experience and progress in the comment area。