What's the oscilloscope for
1. The voltage range of the direct flow signal and the communication signal can be measured
2. The frequency of communication signals can be converted by measuring the cycle of communication signals。
A waveform that displays a communication signal。
4. Signal measurements can be performed separately from two corridors。
5. A waveform capable of displaying both signals on the screen, i. E. A double-trace measurement function. This function measures the difference in the phase between the two signals, and the difference in shape between the waves。
How to use oscilloscopes - oscilloscopes
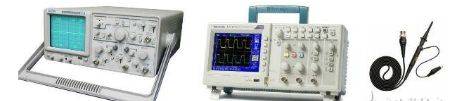
Similar to the one-size-fits-all table, the oscilloscope must first be linked to the detector system, using the oscilloscope probe, as shown in figure 20-4. The oscillators usually have two or four channels (normally marked with 1 to 4 figures, while the spare probe plug is activated externally, which is usually not available), and their lower position is the same, and they can choose to insert the probe into one of the channels, and the small clips from the other end of the probe are connected to the reference point of the detection system. It is important to note here that the trap on the oscillator is directly connected to the ground, i. E., the three-pluged surface, so that if there is a power gap between the reference area of the detected system and the ground, it will cause damage to the oscillator or the detector system, and that the probe will be exposed to the point at which the oscillator will be able to collect the voltage wave shape at that point (normal probes cannot be used to measure currents, with the choice of special current probes)。
Next, you have to adjust the button on the oscilloscope panel so that the measured shape is displayed on the screen in the right size. It is only necessary to adjust the parameters of the oscillator according to the two main elements of a signal - the range and the cycle (the frequency is conceptually equivalent to the cycle), as shown in figure 2。
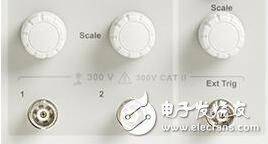
Figure 2
As shown above, the spin button above the plugin in each channel is the adjustment of the width of the channel, i. E., the wave-shaped vertical direction. Turning them would change the voltage value represented by each vertical panel on the oscilloscope screen, so it could be called a "volt" adjustment, as shown in the following two contrasts: the left figure is 1v/grid, the right figure is 500 mv/grid, and the left map is 2. 5 cells, so it is 2. 5 cells, and the right figure is 5 cells and 2. 5 cells. It is recommended that the waveform be adjusted to the right image, as waveforms take up the larger space of the entire measurement range and can increase the accuracy of waveform measurements, as shown in figure 3。
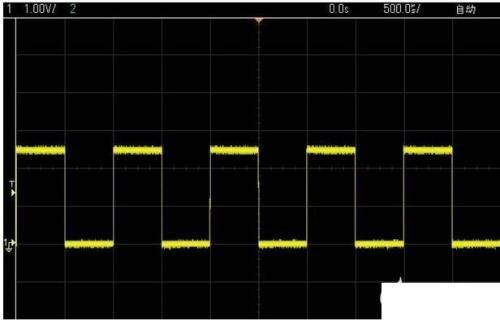
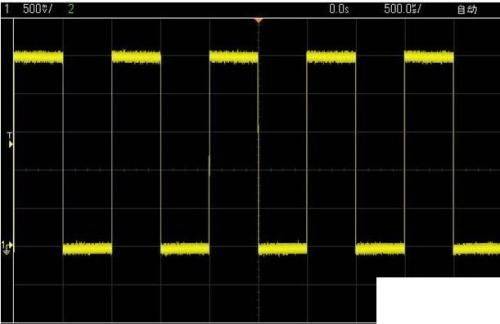
Figure 3
In addition to the voodoo knob normally above figure 3, a knob of the same size (not necessarily in the position shown in figure 20-6) is usually found on the panel, which adjusts the cycle, i. E. The wave-level direction. Turn it to change the time value represented by each grid on the oscilloscope screen, so it can be called the "seconds" adjustment, as shown in the following two contrasts: the left figure is 500us/grid, the right figure is 200us/grid, and the left figure is two cells in one cycle, 1 ms, or 1 khz, and the right figure is 5 in one cycle, or 1 ms. There are no more legitimate issues here, and specific issues are treated in a specific way, and they are reasonable, as shown in figure 4。
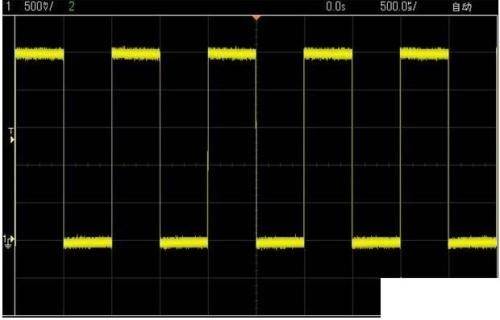
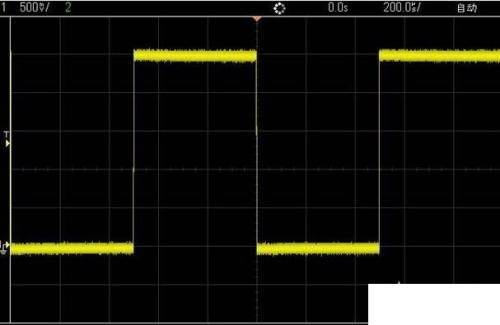
Figure 4 figure
In many cases, only two of the above-mentioned adjustments can be seen in a wave shape that is unstable, shivers and overlaps, leading to confusion, as shown in figure 5。
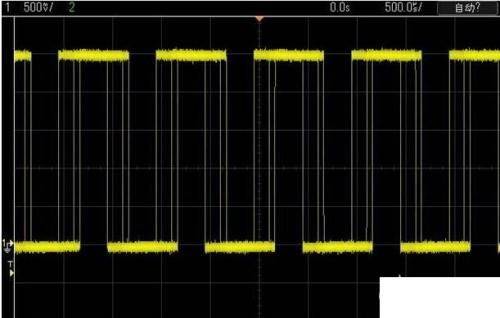
Figure 5
That's why the oscillator triggers are not adjusted, so what is the trigger? The simple point is that the trigger is to set a baseline around which both the waveforms are collected and displayed. The most commonly used trigger settings are based on the level of electricity (which may also be based on time equivalents and the same sense), and look at the waves above, there is always a t and a small arrow on the left, and t means a trigger, and the current trigger level is the value for which the small arrow points. The oscillators always store and eventually show a part of the past and after as the waveform passes through this level, so they can see the waveforms shown in figure 4 and 5. As figure 6 shows, in any case, the waveform will not pass through the t-named position, i. E. It will never reach the trigger level, so the waveform that has lost its benchmark looks unstable. How do you adjust this trigger level to find a trigger spin button on the oscilloscope panel, and the following is a diagram that turns this button and changes this t。
Figure 6. The oscillator triggers the spin button
In addition to changing the value of the trigger level, the mode of trigger can be set: for example, the choice of whether to rise or drop along triggers, i. E., the choice of whether to trigger the level up or down when to increase the wave shape, or to reduce it down, is made by triggering the level, which is generally done through the trigger bar button and the screen-friendly menu key。
After these three or four steps, you can apply the core function of the oscillator, which is used to observe the signals of the single-piece system. For example, if the system doesn't work, use it to gauge whether the waveform of the crystal-thrust feet is normal. It is important to note that the waveforms on a crystal-thrust foot are not square waves, but are more like sine waves, and the waveforms on the two feet of a crystal-thin are different, with a smaller range being entered and a larger range being exported, as shown in figure 7。
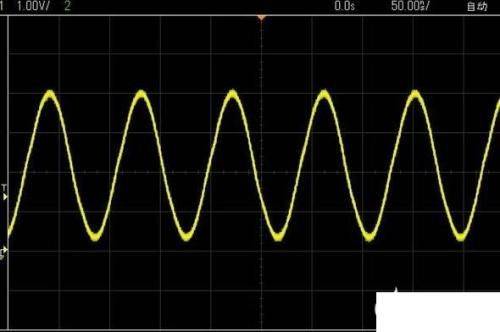
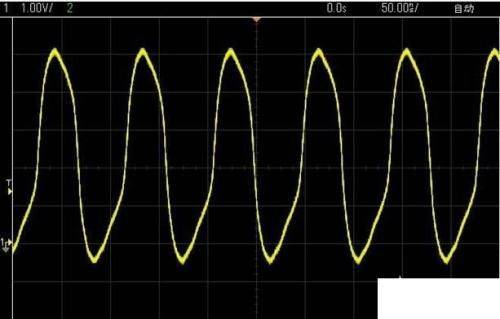
Figure 7 crystal oscillations measured by oscillators