I. Population distribution of the huwan line
I would like to begin by reviewing the history of china's migration for 2,000 years. As we can see from a review of china's historical atlas of history by the editor-in-chief of tan, the demographic and urban transformation of china's land is an ambitious history of migration and deep-tilled land。
Since the spring and autumn wars, the war has forced three major population movements across the country. The population of the north is constantly moving towards the south and leading the development of the appropriate watershed areas, and towns are gradually expanding from the yellow river basin to the yangtze basin. In general, areas with warm climatic conditions, where fertile soil in the respective watersheds is cultivated, tends to be densely populated and urban areas. As was the case during the period between qinhan and qinhan, the plains of the river qui, yellow river, the plains of the north china and the western basin of the mountains; the north-south of wei went to zhang tang and added the fields of chengdu basin, the lower plains of the yangtao river and the plains of zhedong; the plains of the yangtze river were extended between the ages of 10 and song; the plains of the yangtze river and the two lake basins, the coastal plains of fujian, and the plains of the south-east coast and the south-west sea increased in the period between the nineteenth century。
In view of the fact that the size of the population occupies the centre of national geography, there have been two major shifts in the centre of china's population. For the first time, between the five generations and song yuan, population centres were gradually transferred from the centre of the yellow river to the lower part of the yangtze river, thus bringing the total population of the south of the country above that of the north; for the second time, between mid-middle and modern 300 years, the population of the north experienced an explosive recovery and the population of the north and south of the qinqing-ye river gradually became relatively even。
China’s population and towns have changed over the past 100 years. The hu wing line was introduced in the mid-30s and has now been in place for over 80 years. During this period, war, political and economic patterns have had a significant impact on population movements and movements. After the establishment of the new china in 1949, the economy and society gradually recovered and accelerated their development, with a slight change in the size of the population on both sides of the huwan line. The national situation and development strategy study group of the institute of middle studies has calculated that the proportion of the population to the east of the huwan line has been declining slowly since 1953. Between 1953 and 2000, there was a decrease of 0. 29 percentage points, with an average annual decline of 0. 006 percentage points; between 2000 and 2010, there was a decrease of 0. 18 percentage points and an average annual decline of 0. 018 percentage points. If the natural population growth rate on both sides of the huwan line is taken into account, there is actually a slight net migration。
While the hu hwang line expresses the basic pattern of our population distribution, it does not mean that it is a dividing line between population movements and employment. In one region, the proportion of the resident population to the resident population is more than one, which means that there is more emigration. According to six-pu statistics, in addition to the three major towns on the eastern coast of the country, the main centre of the centre of the central and western regions and the surrounding areas, there is a greater influx of people to the west of the huwan line. Of course, the inflow is not large. At the same time, in recent years there have been emerging economic growth points in areas west of the hu hu hwan line, mainly in areas such as humonge, gannan, qinghai and the middle east of xinjiang, according to the spatial pattern of population in and out of the country, as reflected by the large figures。
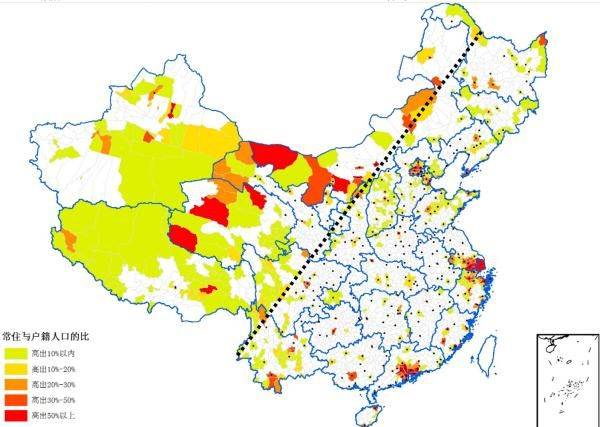
Share of resident and resident population in the 6-pu population (zhang yongbo, zhang feng, 2013)
Over the past 60 years, the economic landscape of our country has been significantly adjusted from the early years of the nation's existence, from the new frontier to the development of black land in the north-east, from the construction of the “big three lines” to the “uphills”, to the reform and opening of the “south-east fly of peacock”. Changes in economic patterns have further increased the spatial concentration of the population. According to the new state council criteria for the size of the urban population, at the end of 2014, china had more than 180 medium-sized cities of more than 500,000 sizes. The number of towns to the east of the huwan line is 89. 5 per cent, which is slightly smaller than the total population. This is due to the relative increase in the concentration of the population in the 100-year-old industrial and mining cities in the area west of the hu hu huwan line。
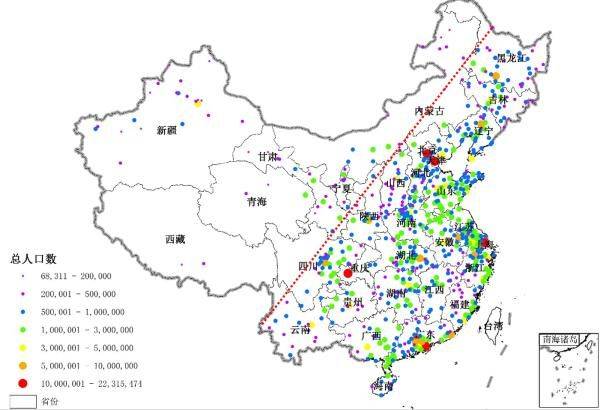
Urban distribution by size
And then it's going to widen its horizon to asia, and the hu hwang line is the asian arc. The region is made up of mountains and mountain systems such as the raya mountains, the pamir plateau, the eastern source of the tsang tibetan plateau, qinqing, the qin hills, the qin-sin-sin mountains, and the qing anching hills. The region is the birthplace of two ancient civilizations in the asian region and is a typical region for the evolution of continental farming。
In the view of the author, this arc is of great significance, and it represents the development of the ancient nations of east asia, south asia and farming, with a range of 100-300 kilometres east of the arc and south, the most densely distributed region in history. Today, in an open development context, the development of inter-faith links between east and south asia has a direct impact on global economic development。
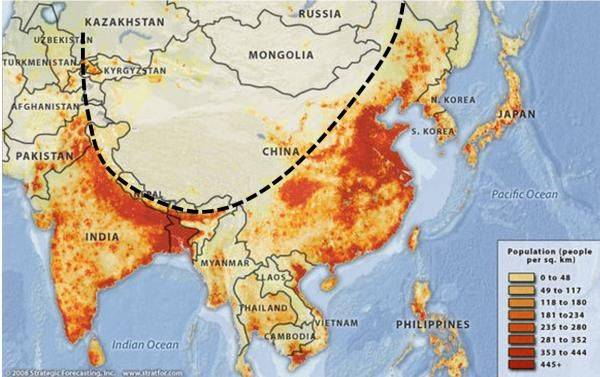
Population density distribution in east and south asia (photo from network)
Ii. Deep adjustments in the economic landscape of china today and their impact on population distribution
Throughout the past two decades of economic development, the country's spatial pattern of economic development is undergoing profound adjustments, from a full-scale development of the national mountain fires of the “15” and “1105” periods to a period of the “1205” when the south fully transcended the north and inland areas. This bodes well for a new imbalance — a widening development gap between north and south. Schoron and others have found that in the three five-year period since 15 years, our regional economic landscape has been dominated by growth in the south (south of the qinqingye river) from relative national growth in previous years。
It was also noted that since 2011 there has been a surge in overcapacity and pressure on real estate stocks in the country, the development of resource-based areas, mainly mining, energy production and raw materials processing, has gradually cooled, with a particular focus on the booming mountains of north-west, north-west and north-east china. Even tianjin and dalian port transport functions were significantly curtailed by the shrinking market for energy raw materials. There is a clear signal that, following the recent reorganization of zhang, china's distant headquarters in tianjin and dalian were evacuated to shanghai and guangzhou, while tianjin was originally the middle-diffusion headquarters and dalian was the medium-diffusion headquarters. In addition, the north-east economy faces a deep-seated structural adjustment that may continue for some time。
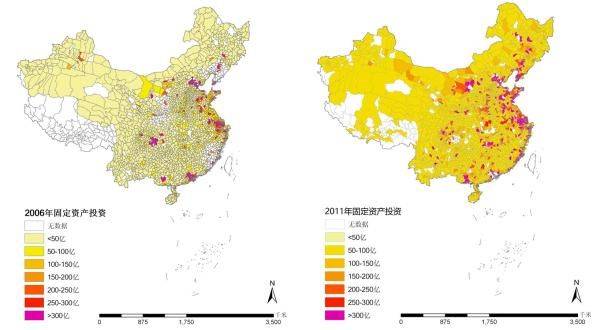
Investment in fixed assets in the 11th five-year national sub-city districts (2006 and 2011)
(quoted from schoron and others, changing the national regional economic patterns from new growth spaces, 2016)
The deepening of the economy has had an important impact on the urban population. If the total population of 35 major cities (including municipalities directly under the government, sub-provincial cities, some provincial capitals and economically powerful municipalities) changes in the proportion of the population in the country, the ability to attract the population is significantly reduced in the cities of the north, even in the long triangle, while the population of the south and the south-west remain more attractive. According to the latest population growth, the population of shanghai has entered a period of marked downward adjustment in four cities in the north, and the population of beijing has entered a period of slow growth, but the population appeal remains relatively strong in guangzhou and shenzhen。
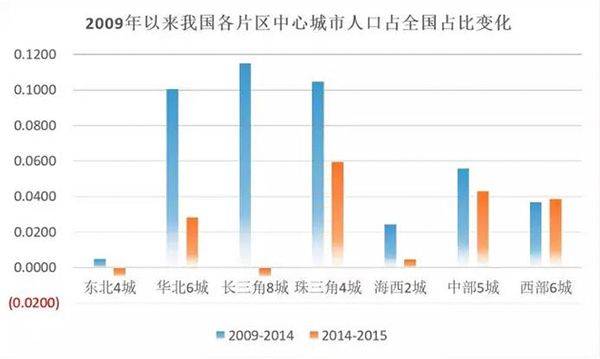
Note: the four cities in the north-east are harbin, changchun, shenyang, dalian, beijing, tianjin, ishibao, houthi hot, chinan and qingdao, and the eight cities of the long triangle are shanghai, nanjing, suzhou, wuxi, changzhou, hangzhou, ningbo and wenzhou. The four cities of the pearl triangle are guangzhou, shenzhen, fushan, dong-sung, and the two cities of haissi are fokzhou and xiamen. The five cities in the centre are zhengzhou, wuhan, changsha, hoi fat, nan chang, and the six cities in the west are zhongqing, chengdu, si an, guiyang, kunming and nanning。
The problems that follow are not encouraging。
First, the population of the north continues to decline, and in addition to the north-east and the whole of the north-west, the economic downturn has a direct impact on the stable social development of these regions. For example, data from the sixth national census show that the fertility rates of the heilong river, jilin and liaoning were 1. 03 per cent, 1. 03 per cent and 1. 0 per cent, respectively, well below the national level of 1. 5 per cent; combined with the region's continuing exodus, the population moved net to 1. 8 million in 2010, in contrast to the net inflow of 360,000 in 2000。
Secondly, the population base remains large throughout the north, with large (over 100 million people) and dense regions such as north china and the middle and lower yellow rivers, and social problems will emerge if economic development continues to slow down. Since song won, economic development in the region south of the river basin has been stronger than in the north, and the north-south gap has persisted. This widening gap will affect stability throughout the northern region. It may therefore be a new space policy challenge to seek future space development policies that match population distribution with economic growth and narrow the gap between the north and the south。
Thirdly, on both sides of the hu wynn line is the past staggered agro-pastoral belt (400 mm precipitation) and because it is the second-tier natural geographic step of the country, geological formations have created a rich energy and mineral resource and are now an important source of energy and raw materials. The region currently has a large and dispersed share of industrial or mining employment, but with macroeconomic adjustments, the industry and mining sector will face a contraction in production capacity, and the number of labour forces involved in re-employment cannot be overlooked。
The national situation and development strategy study group of the central institute of science and technology, trends in population distribution and urbanisation patterns on both sides of the huwan line - an attempt to answer prime minister li keqiang's question, 2016。
According to calculations, 43. 80 per cent of the population lived in the land area east of the huwan line in 2000, down slightly to 93. 65 per cent by 2010。
Data on the proportion of the population living in urban areas to the national population are used here to indirectly avoid the problems of natural and mechanical growth. There are serious technical gaps in the current use of resident demographic changes in some media to compare urban population growth。