Histogram matching mathematical principles 1
The mathematical principles of histogram matching are closely related to histogram balancing, suggesting that the equation of histograms (refer to the mathematical principles of another blog of the blogger, the equation of histograms) be clearly understood, and that hetograms be matched, with images taken from digital image processing -- gonzales -- version 3, which is generally translated and contrasted in chinese and english。
Note: when you look carefully and patiently, you will understand the rationale。
2. Description of variables:
S =t(r), r for input greyscale, s for output greyscale, t for greyscale transformation function (the histogram process is also the greyscale shift), ps(s) for probability density function, pr(r) for probability density function for r。
3. Initiation of the greyscale conversion function of histogram balanced:
Now we have to think about what to do and what to do with the equation. Namely: complete the following conversion from a->b (figure below). Enter 0 ≤r≦l-1, output 0 ≤s ≦l-1, l 2 ≤ and l 8 = 256 = ash. The probability density function of s is required to contain 1 area, so ps(s) (the probability density function of s ps, which cannot be struck at the lower angle) should be = 1/l-1。
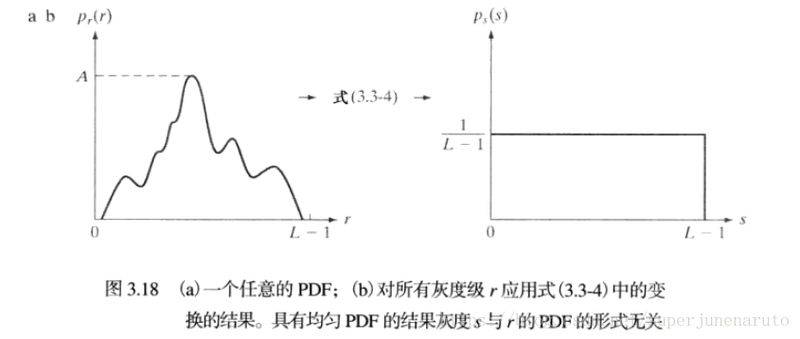
Now that ps(s) = 1/l-1, we want to ask for a greyscale conversion function t, and we need to find a relationship. R,s are random variables and s=t(r), so what does the probability density function of s have to do with the probability density function of r? Is the probability density function for a random variable function。
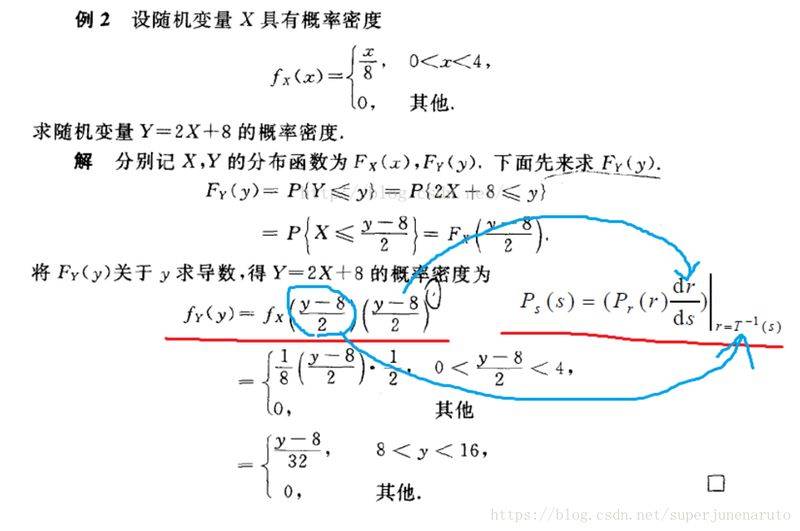
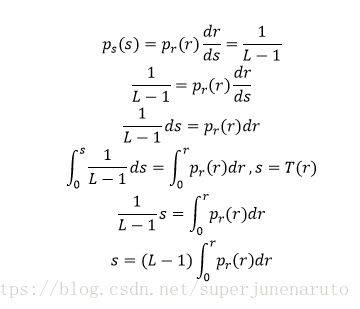
Here we know:
, the formula is derived from the relationship between s and r, i. E., the grey-scale transformation function t, which knows that the histogram is balanced。
4. Core ideas for histogram matching:
Histogram matches the requirement that the resulting image has the shape of the given histogram。
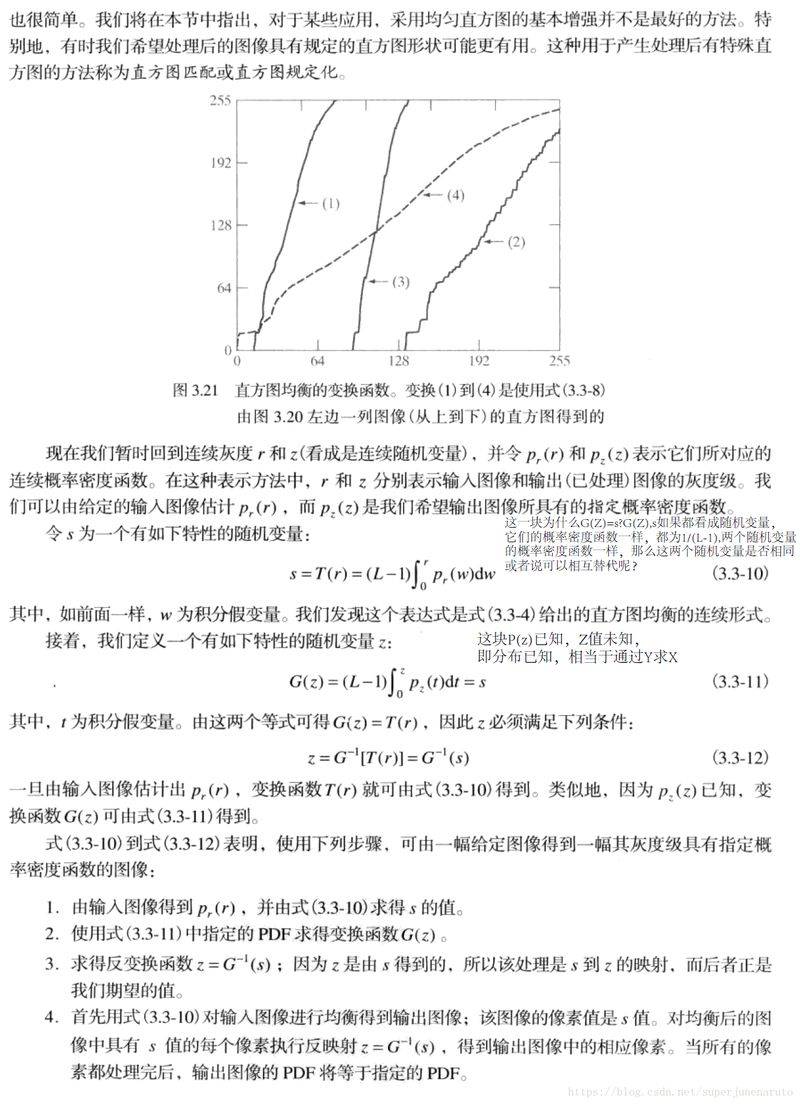
The general greyscale variation requires only one map: r->s, such as histogram balancing. And histogram matches, two maps, r->s->z. What's z here? You'll see after this。
What's a squared t of histogram? As we know above, it's r's cumulative distribution function x coefficient l-1 (cdf, plus: probability density function is PDF). A random variabler, what is sought through cumulative distribution functions? Is also a random variable, recorded as m (the cumulative distribution function of the random variable r is also a random variable). So what's the probability density function? The answer is constant 1 (as with the formula extrapolated above, the only difference between later and earlier is the coefficient). Which means m has nothing to do with the form of the PDF. S = (l-1)*m, so, s has nothing to do with the form of the PDF of r。
What does it mean
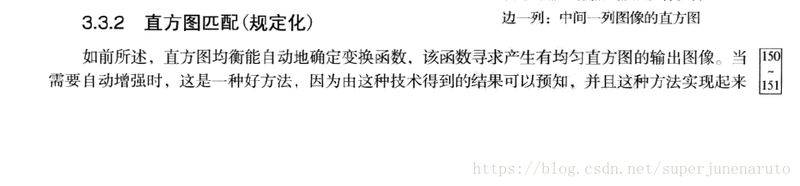
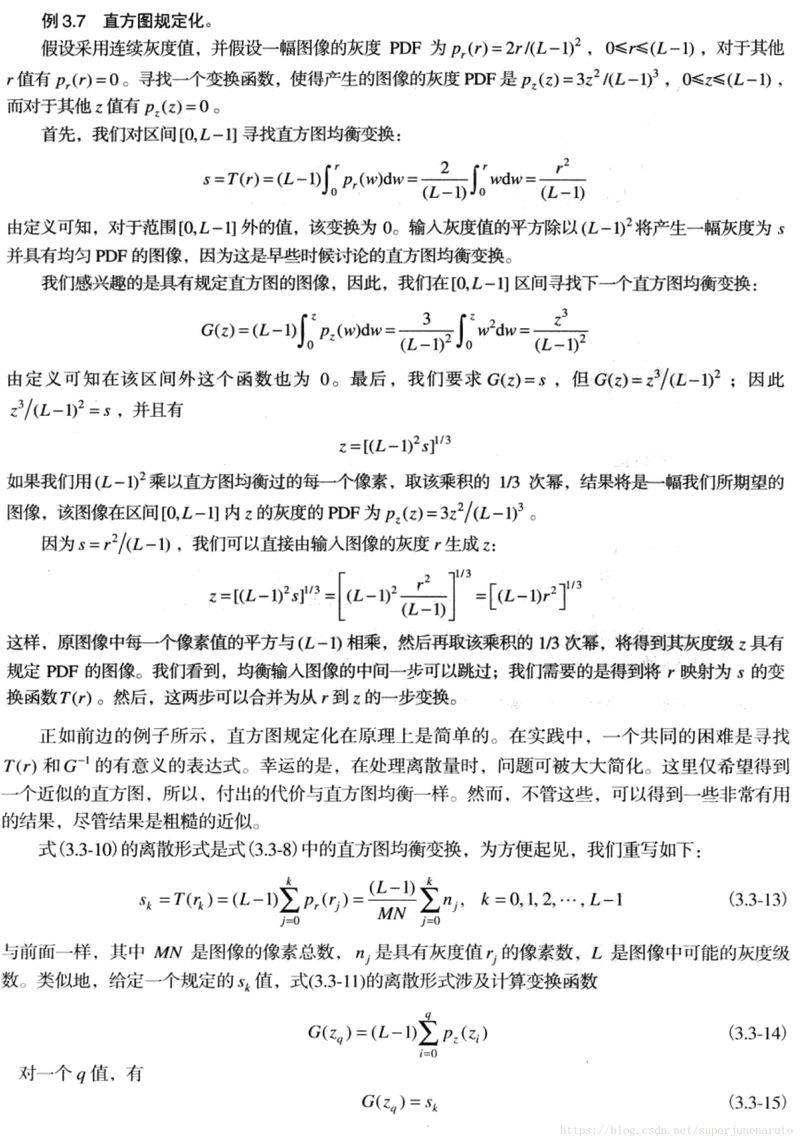
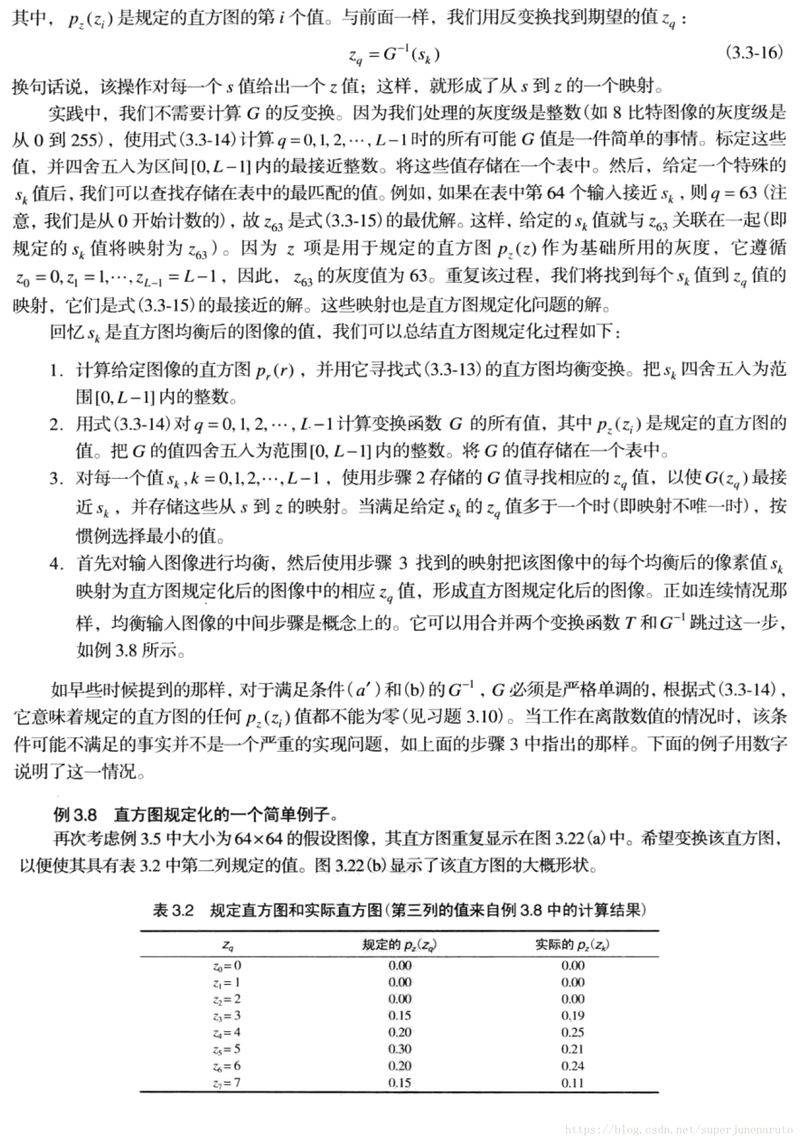
Z is another random variable, and pz(z) is not in any form. The cumulative distribution function of z = the cumulative distribution function of r, that is to say, pz(z) is the shape of the histogram that we specified in advance. This is done by the following formula。
5. Detailed description of histogram:
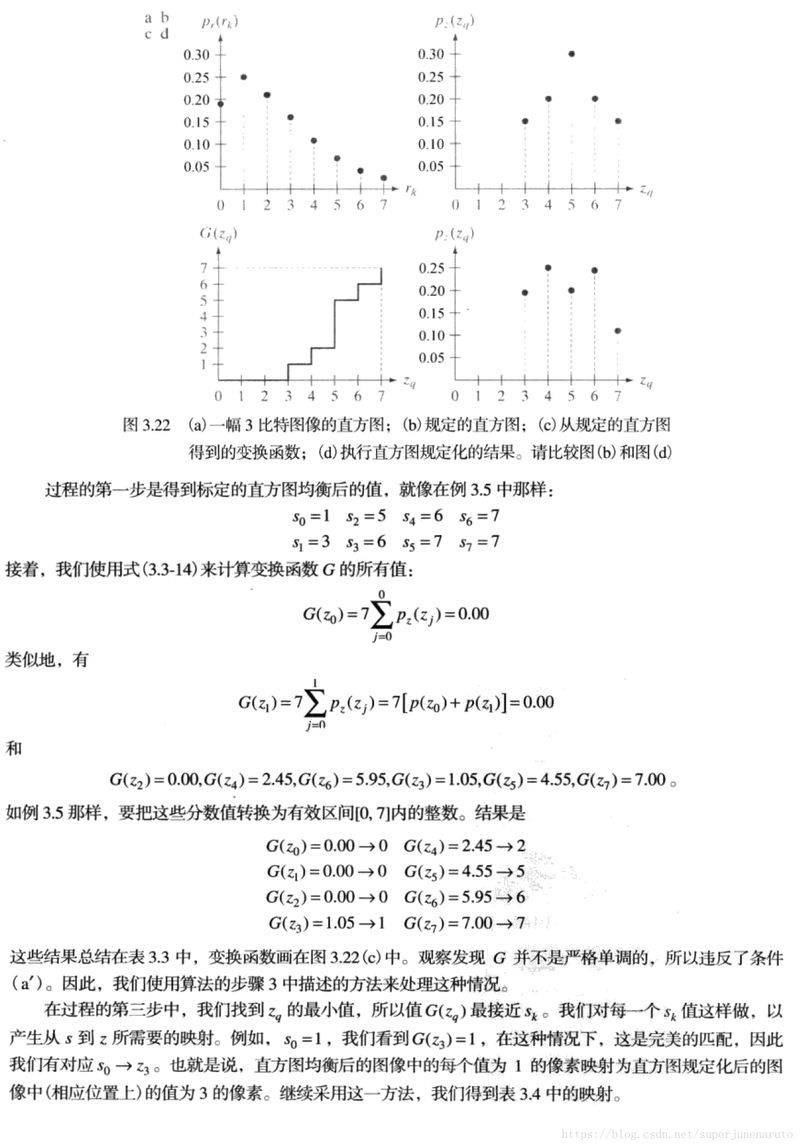
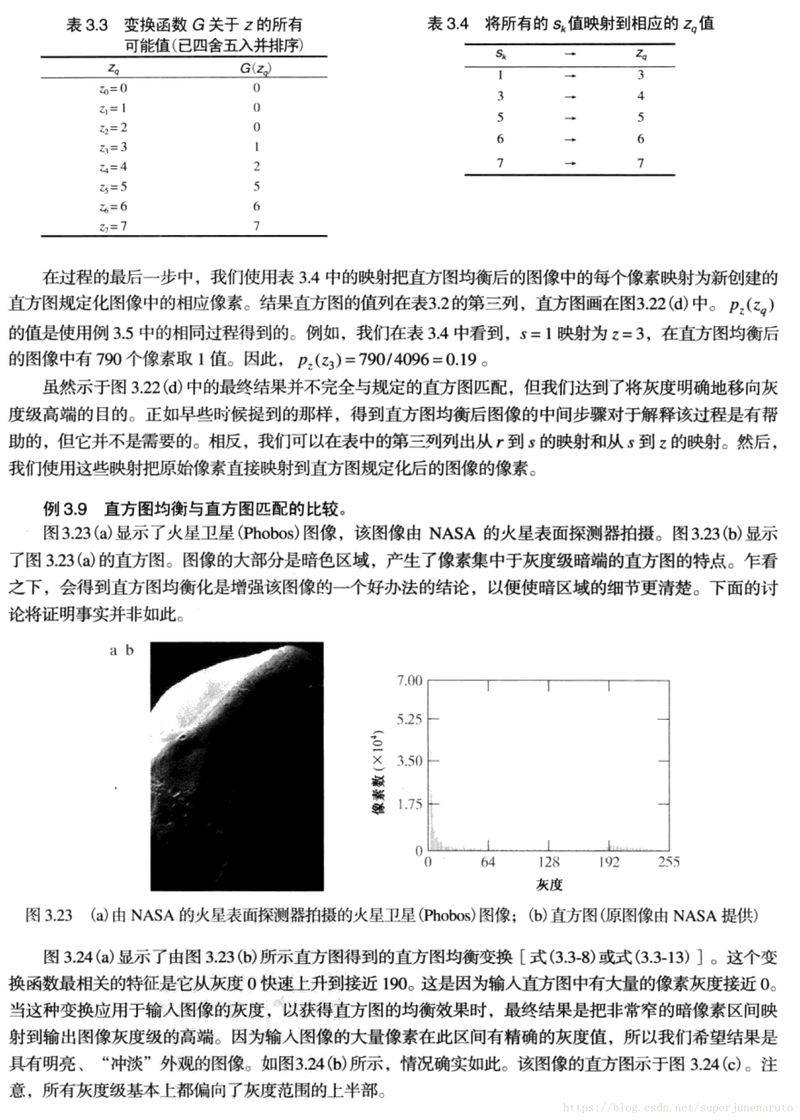
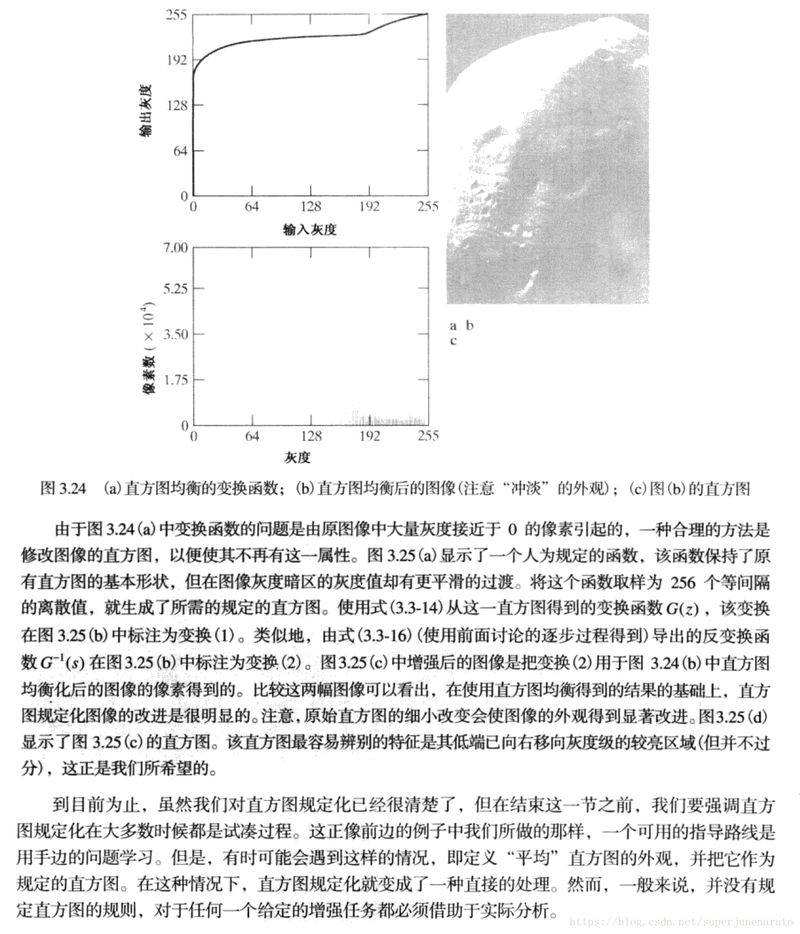
References:
[1]: digital image processing -- gonzales iii
[2]: large edition of probability and mathematical statistics (4th edition)