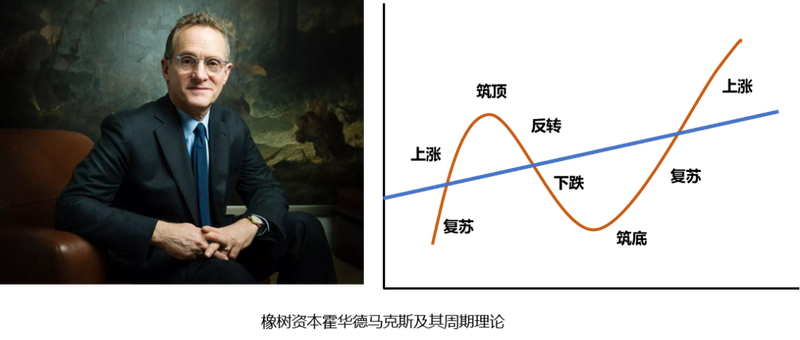
Howard marks, the famous founder of oak capital, compared periodicity to clocks in the book of cycles. Economic performance fluctuates around the centre of the clock, and a full cycle goes through a cycle of recovery, rise, roofing, reverse, fall, bottom-up, recovery again and again。
Investment can only be better guided by the direction of the economy, which is not dependent on the economy. From this period onwards, we will continue to learn the theory of some cycles, while considering its applicability in the light of the current macroeconomic situation. In the current period, let's start with the merlin clock。
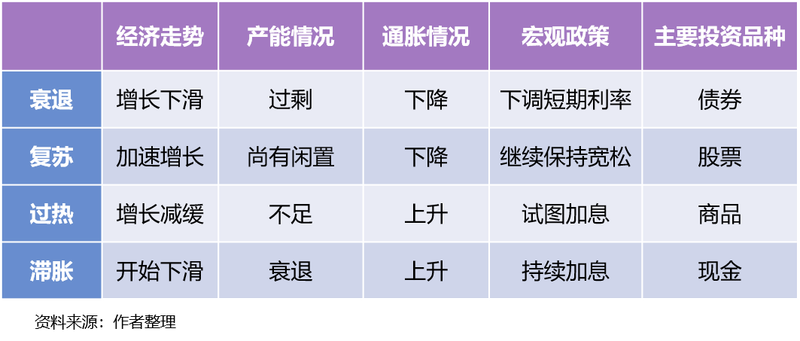
The merrill lynch model is the economic cycle model introduced by the merrill lynch securities in 2004, which, through their statistical analysis of data for more than 30 years, reveal the link between economic growth and inflation and divide the economic cycle into four distinct stages, namely recession, recovery, overheating and stagnation。

The four phases will be recycled, while different phases of the configuration strategy have been developed for differences in the performance of the different asset phases. Specifically:
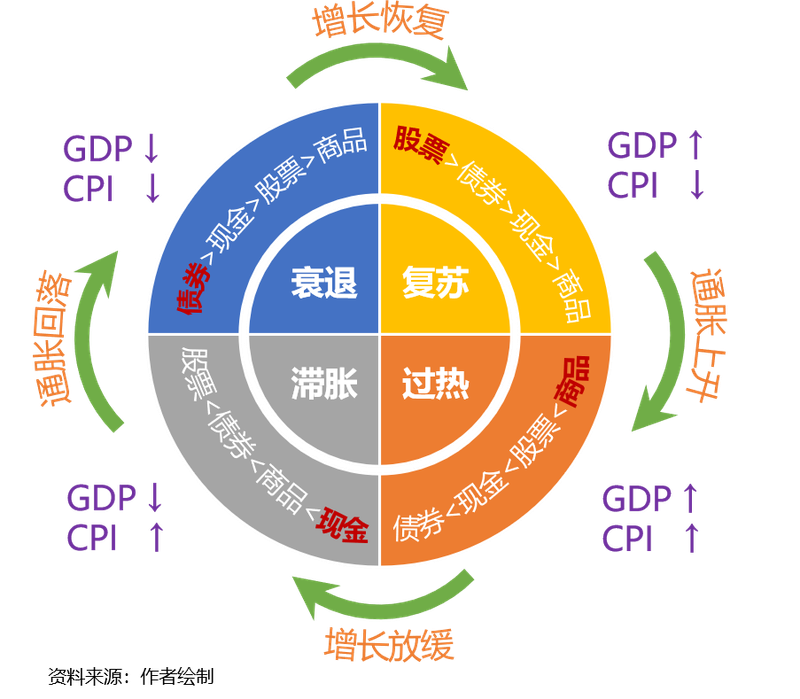
Often we also have the following illustrations of the life cycle of the merlin clock。
One might ask why the economic cycle operates within the framework of the merrill lynch, which is related to the united states federal reserve monetary policy framework. The federal reserve's monetary policy objective is to maintain a reasonable level of inflation (which is not above 2 per cent), on the one hand, and to achieve full employment, on the other. As a result, through its monetary policy and expectations, the fed affects its market interest rates, which can be transmitted to price changes in various asset classes. Thus, the objective of economic growth and price levels leads to changes in market interest rates, thus affecting the movement of large groups of assets。
In practice, by observing economic growth, output and inflation levels, combined with cyclical indicators such as interest rates, corporate profits and so forth, we judge the stage at which the economy is at, thus better guiding investment and decision-making。
In reality, however, economic performance does not simply rotate around the merlin clock, which sometimes moves backwards or skips forward。
Next, we look at the adaptability of the merrill lynch to our economy in the context of our relevant economic indicators。
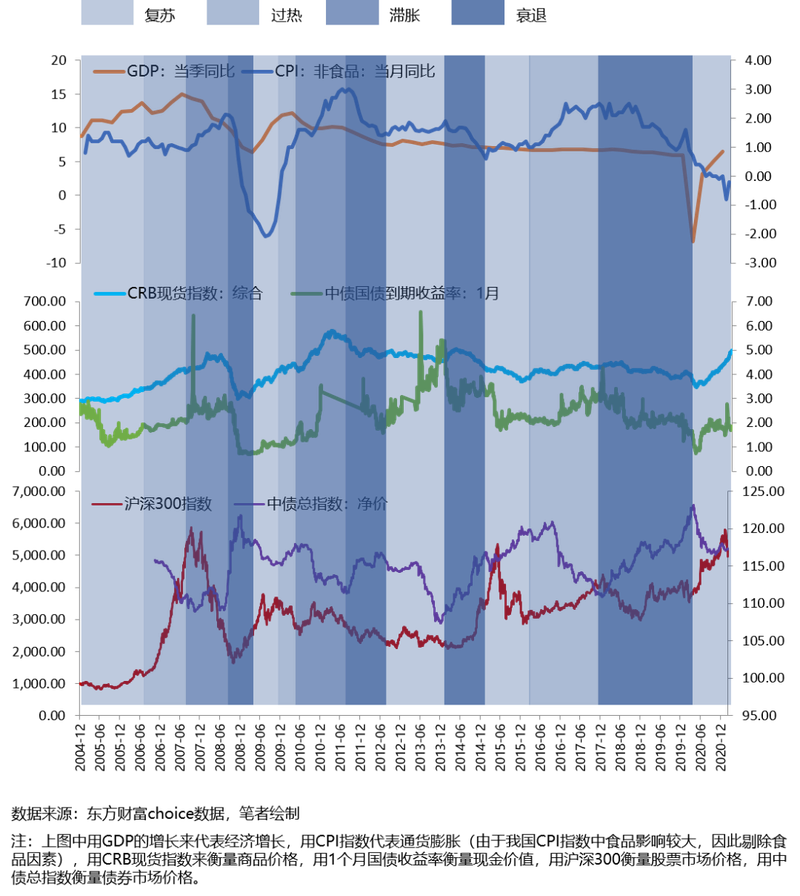
By briefly dividing the above-figure GDP growth and the growth of the cpi (non-food) to match the merrill lynch cycle, we can generally conclude the following:
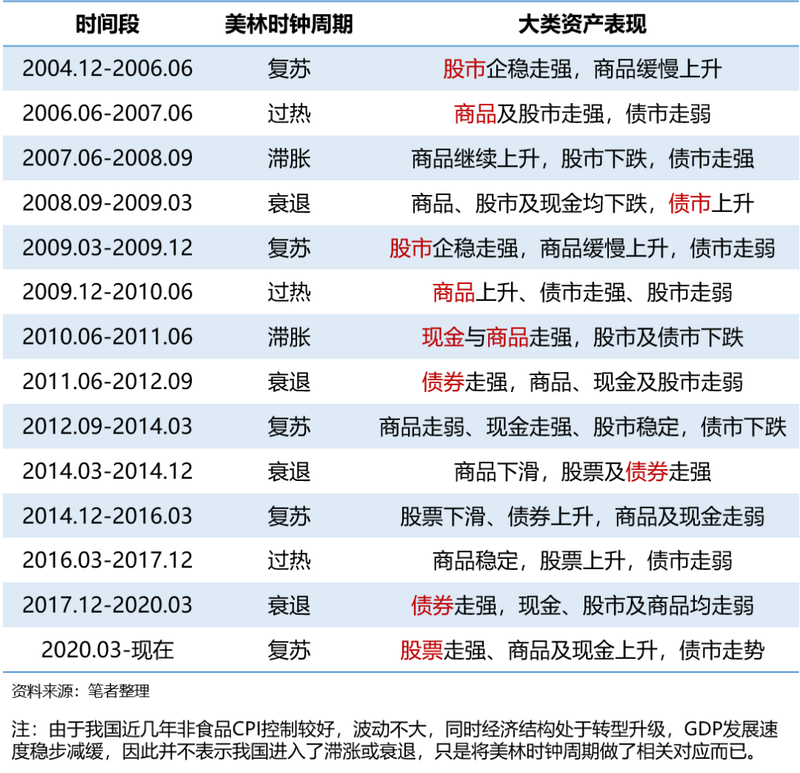
As can be seen from the simple brevity of the above table, the merrill lynch is somewhat adaptable to the country's economy, but at the same time it is found that part of the time does not rotate according to its pattern, sometimes skips some stage to the next stage and sometimes goes backwards. We also see that, apart from a few years in which the broad asset allocation differs from the merrill lynch conclusion, most of the remaining years coincide with its asset allocation recommendations and demonstrate some effectiveness。
The merrillian clock has been used differently in our country, mainly because of differences between our monetary policy objectives and those of the united states, whose monetary policy is largely based on economic growth and changes in inflation as a means of influencing interest rates and is roughly the same as that of the merrill lynch, but our monetary policy is a comprehensive goal encompassing economic growth, full employment, price stability, international balance, etc., and therefore more rigidly regulated the economy. Moreover, the country's asset prices, in addition to those affected by monetary policy, can be influenced by a wide range of policy, administrative, regulatory and other factors, thus making their cyclical performance more moderate and free from large inflation and recession。
In the case of cpi, our inflation levels in recent years have been largely influenced by food prices, in particular pork prices, which have been less volatile and lower than 3 per cent since their highs in 2010 and are still at negative levels this year, so that we have lower inflation pressures and lower probability of overheating and stagnating。
Therefore, based on the economic performance of the country and the rotational pattern of its cycles, we have put forward asset allocation strategies for your information。
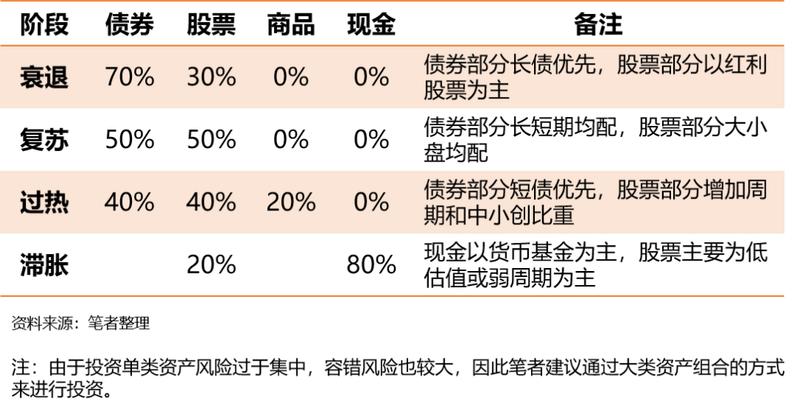
The above-mentioned asset allocation strategy is not static, and some adjustments can be made to different economic cycles, as well as to different stages of the cycle, such as the introduction of equity parity in the early stages of the economic recovery, a gradual adjustment to the ratio of 50 per cent of commodities in 40 per cent of the stock of bonds when the economy is overheated, and a continued increase in bond weights at the end of the heat, a reduction in equity weights, or a direct replacement of bond assets with monetary funds。
Perhaps you should say, how do i know what the cycle is, how to judge recovery, how to know it's overheating, which we will speak systematically through a series of indicators later。
I'll see you next time
Summary of text
The performance of the economic cycle is regular and can be observed by economic trends and inflation
The merrillian clock cycle model is based on 30-year statistics in the united states and has a high accuracy rate for the united states in terms of the history of large asset classes
The use of the merrillian clock will vary in our country, mainly as a result of monetary and other regulatory policies, but also as a reference for investment
Based on the merlin clock model and the economic situation of the country, a corresponding investment strategy is proposed