Over the past two years, ai has become the subject of a digital transformation of enterprises. Many companies are looking at large models, doing intelligence analysis, pushing automated decision-making, but when they get to the business scene, problems begin to focus。
The poor calibration of data, inconsistent sectoral statements, conflicting statements, no one dared to use them, and ultimately it was not ai that was not intelligent, but the bottom data and indicators that went wrong first。
At the end of the day, whether the digital transformation of an enterprise can go deep, whether ai can really land, not just with or without data, but, more importantly, with a clear, uniform and implementable system of data indicators. It is difficult to make a real difference when indicators are unclear, operations are unclear, management is unmanageable。
So this article is about the system of data indicators. If you are preparing to promote data governance, business analysis, or you are preparing for ai's landing, this article suggests a direct collection。
In fact, when it comes to indicator systems, most of them end up on a more basic level, namely, how the data standards are set, how the silos are set and how the statements come out. Because of the problems of many enterprises, it appears that the indicators are not uniform and that the bottom floor is often not stable. Just as recently i saw a digital construction solution with well-systematic content, linking the key elements of standard data specifications, data warehouse set-up and reporting systems built. If you've been doing this lately, you can find out
Https://s. Fanruan. Com/tq66k (copy to browser open)
I. Concept of a data indicator system
As many people listen to the data indicator system, they think it's a big word, like a strategic thing. In fact, it is the standard language used by enterprises to measure business performance in a uniform manner。
The so-called indicators are not just a number, but rather the way enterprises define business outcomes, processes and efficiency. For example, sales are indicators, order conversion rates are indicators, customer loss rates are indicators, and efficiency, buy-back rates and delivery timeliness rates are indicators. The indicator system is to organize these indicators according to operational objectives, management levels and application scenarios and to create a structure that is business-oriented, problem-seeking and process-oriented。
A relatively complete system of data indicators, usually containing these layers:
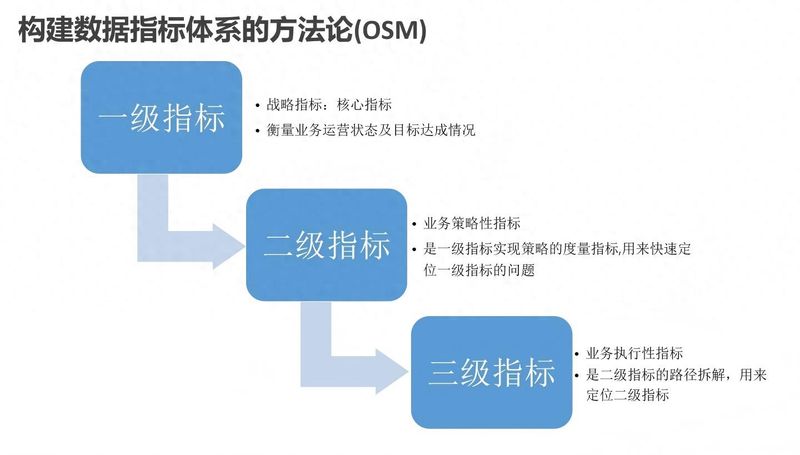
Therefore, the data indicator system is not simply a list of indicators, but rather links operational objectives, data rules and management actions. The core issue it addresses is not whether the enterprise has data, but whether it can see business with the same set of criteria。
Ii. Structure of data indicators
Many enterprises start with an indicator system, and one of the most likely mistakes is integrity. Everything, everything, everything, everything, everything, everything, everything, everything, everything, everything, everything, everything。
A truly effective system of indicators is not piled up, but broken down at the level of operational objectives. It is suggested that the next steps be followed。
1. Targeting
Indicators are not produced in a vacuum; they must be targeted services。
For example, in a retail business, the central goal this year may be to improve the profitability of the shop. It would then focus on not just sales, but also on the price of a single customer, the associated ratio, the māori rate, stock turnover, and the member buy-back rate。
So the first step must be to figure out three things:
There are goals and indicators, and the sequence cannot be reversed。
Classification of indicators
The indicators for many enterprises are results and no process. Once a month, only income, profits, orders and so forth were found to be problematic, but it was too late to remedy it。
It would be more logical to group indicators into at least three categories。
Taken together, these three types of indicators enable enterprises to see both the results and the reasons, and to anticipate risks in advance。
3. Unified calibre
The problem for many enterprises is not the absence of indicators, but the homogeneity。
Marketing stated that 500 new clients had been added this month, operations stated that only 380 had been added, and treasury had made a further reconciliation and became 420. Why is that? The statistical rules are not uniform because the new clients are registered, first-purchased and contracted。
It is therefore important that the system of indicators be clearly defined, at least:
This step seems to be fundamental, but it is the most critical. Because once the indicator system is used across sectors, the calibre is not uniform and all subsequent analyses are distorted。
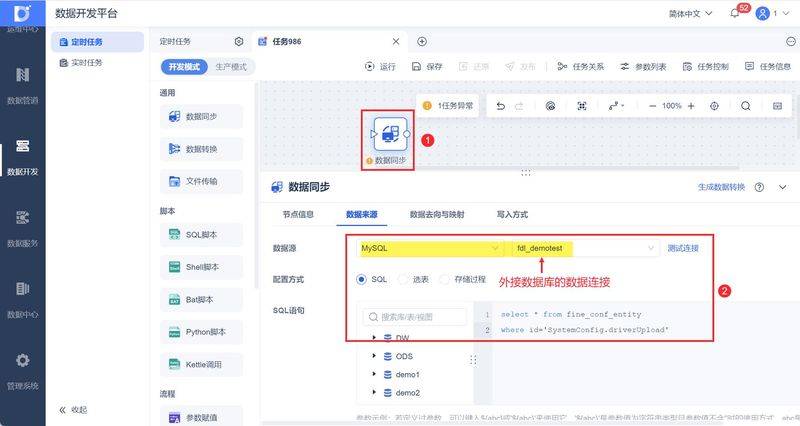
At this stage, many teams encounter a real problem, namely, that the data are scattered in erp, crm, oa, financial systems, electrical platforms and a variety of business repositories, and that the data need to be accessible before they can be standardized. Like finedatalInk-type data sets are tools that are often useful in such settings. In particular, a stable and configurable data synchronization capability saves many duplicate communication and manual processing costs when enterprises are to pool data from multiple systems into a unified data base。
4. Number of control indicators
Many felt that the more comprehensive the indicator system was, the better, but in practice too many indicators would dilute the focus。
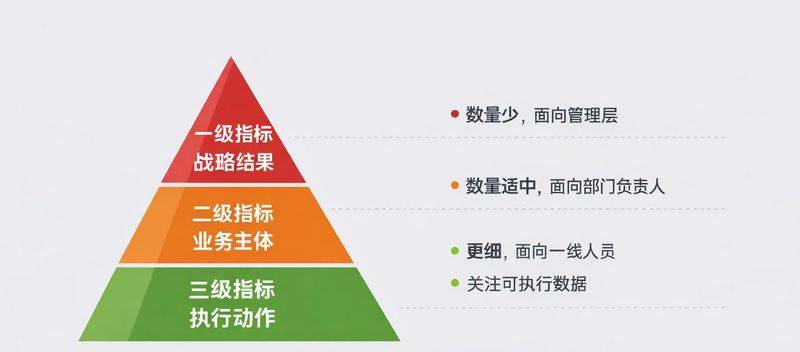
A more practical approach is to establish a hierarchy:
In general, high-level attention is focused on a small number of key indicators, mid-level needs to combine results and processes, and front-line attention to implementable data feedback. The difference in indicators seen at different levels makes it easier to promote practical action。
Organizational synergies
The indicator system appears to be a data item, essentially an operational and management project。
If only the data team defines the indicators itself and business is not involved, there will be two eventual scenarios。
One is that indicators are too technical to understand business。
Another is that the definition of indicators appears to be okay, but does not conform to actual management habits and does not land。
So in the construction process, at least three types of players will be brought in。
Only if these three parties are involved will the indicator system not remain on paper。
6. Systemicization land
Many enterprises have well documented their indicator systems, and training has been done, but in a few months it has been scattered. The reason is simple: the indicators do not enter the daily workflow。
A truly effective system of indicators should be at least in these places:
Only when indicators and processes are tied will they remain in use and the indicator system will live。
Application of the system of data indicators
When many enterprises complete the indicator system, there is a illusion that the project is over. On the contrary, the stage of real value is when the indicator system becomes operational. The most common applications are at least three。
1. Harmonization of business perspectives
This is the most basic layer。
As management, business and data teams begin to look at the same set of indicators, many communication costs fall immediately. It took half an hour to run a business, and now we can discuss directly where the problem came from and how the move was to be adjusted。
For example, while the market sector is seeing an increase in the number of clues, feedback from the marketing sector has not improved. If the indicator system also defines the layers of clues, effective lead rates, access rates and turnover rates, it will soon be possible to determine whether the problem is in the quality of the clues or in the transformation of sales。
2. Discovery of anomalies and root causes
The value of an indicator system goes beyond demonstrating results and, more importantly, helping to position enterprises。
For example, there was no significant decline in the number of orders for a month, but the profit margin suddenly fell。
If there is only a profit margin as an outcome indicator, one can only guess。
But if the associated indicators of discount rates, return rates, logistics costs, channel structure, and individual prices are synchronized in the system, they can be searched down the data chain, whether they are promotions, channel deviations or higher performance costs。
At this stage, enterprises tend to find that the difficulty in using indicators is not the display of panels, but the stability of data links, the timeliness of updates and the sustainability of data alignment between different systems. In particular, enterprises with multiple and highly volatile business systems need more stable data sets at the bottom。
If the data depends on a manual guide, not only is it slow, but it's easy to float, so our team's been using the finedatalInk, a tool that synchronizes multi-source data to the unified platform in a rule-based manner, allows for more stable indicator updates and easier detection of unusual fluctuations. A further step forward would allow teams to focus more on analysis and optimization when data bloodlines, mission movements and simultaneous surveillance are clearer. You can experience it in your hands:
Https://s. Fanruan. Com/vpvz8 (copy to browser open)
3. Support for precision operations and ai landing
Many businesses are talking about ai, but it is enough for ai to have a model, and it must be based on a clear, stable and credible system of indicators。
Why do you say that? Because both smart early warning, business forecasting, recommended strategies and automatic generation of analytical findings require clear evaluation criteria. If there is no clear definition of what is called a high-value customer, what is an abnormal order, what is a healthy inventory, it is difficult for ai to really understand business。
The indicator system has at least three roles here。
Thus, if an enterprise is to move ai from a demonstration to a business-based application, the previous indicator system is largely unwieldy。
Summary
The data indicator system is both complex and complex and simple. It is simply its essence, which is to link the objectives, operations and data of an enterprise with a unified set of criteria. The complexity lies in the fact that it is not just an indicator, a statement, but a combination of target dismantling, calibration, data penetration and application。
A truly valuable system of indicators must not be seen as professional, but rather as a way for enterprises to be visible, responsive and action-oriented. It is the basis for business analysis and a key link in the depth of digital transformation。
When data are credible, indicators are harmonized and links are stable, the digital capability of the enterprise can be truly upgraded, and ai has the opportunity to move from lively to practical。