Brief definition and characteristics
Radar remote sensing imaging, generally referred to as synthetic aperture radar (sar) remote sensing, is characterized by active launching of electromagnetic waves, full-time, round-the-clock observation capabilities that do not depend on solar light and climatic conditions, and some penetration of clouds, small rain, vegetation, and dry features. In addition, by regulating the best observations, the stereo effect of the imaging can effectively detect the spatial morphological characteristics of the target feature。
Geology was the first area of application for radar remote sensing, in addition to military reconnaissance, starting with a large-scale on-board radar geological application experiment carried out in the 1960s in the united states of america in a woody, cloud-covered south america. After entering the 1980s, on-board radar remote sensing has been applied as a mature technology for geological detection, while on-board radar remote sensing has flourished. Synthetic aperture radar (sar) images can provide a wealth of geological mineral information, such as geological formations, rocky and invisible bodies, with unique advantages, particularly in the detection of geological formations, such as volcanoes, meteorites, mass fractures and metal deposits under the control of the tectonic belt。
With the emergence of new imaging radar remote sensing techniques (polarization radar, interferometric radar) and the deepening of geological applications, radar remote sensing has become increasingly informative and comprehensive, and data processing methods and techniques have become more sophisticated, and radar remote sensing has advanced to measurements and research that can be carried out in the form of earth crust alteration, seismic breeding, plate movement and ground deposition。
Research history
As early as the early 1970s, forest surveys and mapping studies in north america and the tropics began to be conducted abroad using a single-band real aperture radar (ar). The multiband, multipolar synthetic aperture radar (sar) system, represented by the nasa jet propulsion laboratory (nasa/jpl), cv-990/980 airsar and the canadian centre for remote sensing (ccrs) cv-580sar, carried out numerous experiments in north america and europe in the late 1970s, particularly since the 1980s. On the basis of these experiments, various studies have been carried out on forest type identification, assessment of deforestation and reclamation lands, estimation of biomass and forest structure parameters, and quantitative analysis and simulation studies on forest microwave dispersive characteristics have been initiated, using image processing and translation methods based on optical remote sensing。
To date, however, remote sensing data from imaging radars are far less widely applied than optical remote sensing data, and the main obstacle is that it is difficult for the users to understand the strength, phase and polarization of information contained in sar data, the characteristics of which differ significantly from the characteristics of optical remote sensing images; moreover, the unique geometrical aberrations and spots of sar images have a significant impact on the application of sar image data. Sar remote sensing data applications have become widespread over the past 10 years as a result of the rapid development of computer hardware and software, the development and refinement of sar remote sensing data processing methods and microwave dispersion theory and application models. Imaging radar remote sensing has become one of the essential earth observation technologies in the ecological environment, disaster monitoring and global change research, and is playing an increasingly important role. One
Geological applications
In the development of radar remote sensing, single-band, unipolar and multi-band, multipolar radar images are widely used in geology. Important insights and discoveries have been made in rock recognition, tectonic analysis, mineral surveys and regional geological filling maps, bringing new life to traditional geology。
Rock recognition
The differences in the physical and chemical properties and composition of the various types of rock not only give the rock different mediated constants, but also make it important that, after long periods of winding and erosion, the surface of the rock presents its own complex geometric shape and surface roughness, thus providing the possibility for radar recognition of the geometry。
On radar images, rock types are identified and analysed, using, inter alia, rough surfaces, weather features and geomorphological patterns of rocks. The roughness is a characteristic of the behaviour of the rock, which is an important factor in determining the color of the images of the rock, which, as a result of their winding effect, form different surface forms and are reflected in different textures on radar images and have characteristics such as water networks, vegetation, cropland, etc. For example, the caster landscape, which is the main deciphering basis for limestone and white clouds in the humid areas, is characterized by radar images of hay piles or hills. There is no water system pattern in the quest landscape, which features the hill, except for a no-returned dome due to the potential accumulation of water in circular rock holes. Like in dry areas, limestone often breaks in bulk, forming many angular reflectors and showing strong echoes on radar images. Image processing and enhancement techniques can also be fully utilized in the process of interpretation to improve the resolution of rocky properties. The combination of sar images with tm images resulted in information that both maintained topographic features and geological formations and highlighted the distribution of different rocky rocks on the images. In addition, margin variations and his are a very effective method of geological identification in multi-band image processing, which reduces the impact of terrain slopes and slopes, thereby increasing the severability of various types of rock. Two
Decomposition of geological formations
Sar's side vision is sensitive to geometrical patterns and allows for the detection of geological formations to form images with a high sense of stereotypicness, allowing for the visual analysis of geological formations and the discovery of tectonic phenomena; moreover, the work of the sar active emitter of electromagnetic waves enhances the structure of a given extended direction and is detectable. On-board, on-board, or radar images in different bands, online geological analysis plays a significant role. Radar images can identify wrinkled structures, and the key to radar images for mineral investigations is to identify and control mining structures。
Mine-mapping is sensitive to changes in the large surface topography, such as faults, cracks, sand dunes, formation rocks and head openings, which often cause significant changes in the landscape, the type of cover and roughness. From the analysis of the colours, shadows, especially medium and macro textures of radar images, not only information on the topography, but also more intuitive information on the location and direction of geological formations, which can be reflected in parameters such as the direction and angle of radar beams, which are most informative and detailed when the radar beam direction is vertically or close to the advantaged linear tectonic direction, given that in such cases the linear tectonics are very clear in texture. If the angle is moderate, then the image information is not lost or deformed because of shadows, overlays, constrictions, etc., then the geological formation information is easily presented through texture analysis. Through texture analysis, the integration of landscape, topography and geological formation information could further lay the foundation for information and understanding of regional tectonic movements. Two
Base rock and volcanic surveys
Owing to the characteristics of the imaging radar side vision, the unique topographical features created to identify volcanic activity are highly effective. The unique permeability of radar remote sensing makes it important in geology applications. The analysis of images of the arrazon plateau area of inner mongolia obtained by space shuttle imaging radar by guo huadong and others revealed that the substrates through the sand belt still clearly present a bright echo and show a fractured structure within them. Two
Ecological applications
Remote sensing imagery applications in the ecological environment can be divided into direct and indirect applications. Direct applications include: 1 land cover/use classification to decipher landscape models; 2 estimation or inversion of various biophysical parameters (e. G. Biomass, tree height, leaf area index, etc.) that are closely related to ecosystems; and 3 monitoring ecological events and processes of change, such as forest fire monitoring, within larger geographical areas or over longer periods. Indirect applications include the application of remote sensing data to other processes related to the ecological environment that can directly influence the functioning of ecosystems. For example, remotely sensed data are used to extract information on vegetation index changes in a given region and are then calculated using the vegetation index as input parameters for an ecological process model。
A summary evaluation of the role of satellite-borne sar data in monitoring the ecological environment was conducted by the nasa radar remote sensing applications group of the united states, which agreed that the application of imaging radar to the earth's ecological environment could be divided into four categories: 1 land cover classification. 2 forest biomass estimates. Monitoring of the detection of other surface dynamical processes of flooding. One
Land cover classification and vegetation mapping
Many ecologists use remote sensing for land cover classification as a basis for further research in specific research areas. The application of radar data is still necessary despite the extensive application of satellite remote sensing data in the visible and infrared bands to land cover classification. First, the original signals obtained by the imaging radar are completely different from visible light and infrared sensors. For both flood-inundated forests and terrestrial forests, it is difficult to distinguish between the same spectral features on visible/near-infrared images because of their extreme intensity; however, radar images can easily detect the inundated forests, thus facilitating the division of the two types of forests. Optical remote sensing affected by climate and sunlight is the second cause of the need to use radar images. The continuous coverage of clouds is, or happens to be, the only reliable data source for acquisition, monitoring, mapping of vegetation-covered terrestrial ecology when vegetation grows to be most suitable for visible light/near infrared identification. In addition, radar image data are in most cases a useful complement to the information available to visible/near-infrared sensors。
There have been many successful examples of forest type identification, classification and mapping using imaging radar remote sensing data. One
Biomass measurement
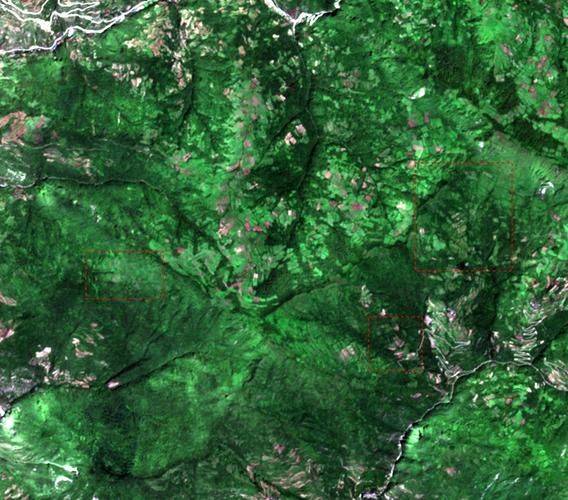
The amount and distribution of biomass on the earth's surface is critical to the global carbon cycle. Carbon exists mainly in the form of forest biomass, so monitoring biomass changes can provide the most basic information for understanding the global carbon cycle. However, because measuring biomass on the ground is not only time-consuming and exhausting, but is sometimes constrained by natural conditions, accurate access to a given area or an ecological type of biomass is difficult. An important element of radar ecological research is the estimation of biomass. A large number of studies have shown that optical remote sensing data are not suitable for detecting the vast majority of ecosystems because of the low saturation biomass of optical remote sensing data. Studies have shown that radar backscatters are highly sensitive to biomass. Currently, imaging radar remote sensing provides the most promising methodological means of estimating biomass. One
Flood zones and wetlands detection
When water is present on the surface of the vegetation cover, the electromagnetic waves launched by the imaging radar interact with them differently from the surface of the non-wide flood zone. Inundated ecosystems can cause significant increases or decreases in radar backscatters, for example, where there is a forest coronal, the presence of sub-capsulated water will form a secondary reflection of the surface-tree dry, leading to an increase in radar backscatter strength, which can be detected in longer bands (l and p bands). For wetland ecosystems with long herbs, the presence of detached water under vegetation enhances the electromagnetic forward dissipation, leading to lower back dissipation. Relative optical remote sensing images, using radar remote sensing images from flood plains obtained, allow for more effective monitoring of the spatial and temporal distribution of flooding in flooded vegetation areas. In general, recurrent flood zones are closely linked to wetlands, which coexist. There are many ecological applications of sar remote sensing data based on flood-wide zone and wetlands detection. One
Monitoring of ecosystem dynamics
The successful operation of many on-board radar systems for 24-hour, 24-hour observations at the international level has ensured the development of studies on ecosystem dynamics. When changes in vegetation freezing/melting status are monitored by imaging radars, at microwave frequencies, freezing means a significant decrease in soil and vegetation transmission constants, as the crystal structure of ice prevents the rotation of soil and polar water molecules within vegetation, which results in a sharp decrease in radar image intensity (about 2-4 times)。
There are also monitoring crop trends for crop growth assessment; forest fire monitoring, which shows that forest fires have very visible signature signals on sar images; and flood inundation mapping, which accurately identifies damage to ecosystems, such as the extent and distribution of flooding, such as crop, grassland, residential land, etc., and the extent of land sanding, and accurately calculates the area affected, assesses the extent of the disaster, in order to organize timely relief and undertake post-disaster ecosystem recovery and reconstruction. One