Abstract: the laser quadrature detection system is an important component of laser-guided weapons and an accurate assessment of their performance during the design phase is conducive to the iterative and optimization of the design programme. A simulation of the quadrimetric detection system was performed using lighttools software. By establishing target models, models of optical systems and models of quadrant detectors, the system can be effectively imitated, combined with the principles of the quadrifugal detection system, to obtain angle deviation and margin bands; models can imitate the dispersible light of the system and assess the impact of the dispersible light on the system; and laser dispersive effects can also be simulated to analyse the effects of dispersive properties on the output and margin range of the detection system. Modelling and imitation of the lighttools software provide an accurate basis for design optimization. Finally, the simulation model is validated by experiment, imitating the basic consistency between the range and the scale obtained by the experiment in the range ±15°。
Keywords: quadripartite detection system; lighttools; scattered light; laser dispersion
Introduction
The laser quadrant detection system is the core device of the laser semi-director's lead and can be used in multiple laser-guided weapon systems. The work of the laser semi-active pilot is the laser target indicator, located outside of the shell, which tracks the laser signal reflecting the target and calculates the target information on the basis of this signal, which is then processed into the guidance signal by means of a computer composite missile attitude signal and in a given guidance form, and is exported to the implementing agency to enable the weapon to follow the target. The advantages are high guidance precision, high intervention resistance, simple structure and low cost of weapons systems. For example, copper-scaves in the united states and russian red land laser-guided shells are guided by semi-active lasers and perform well. The united states halpha laser guided missiles are also led by semi-active lasers。
Using the lighttools software, this paper simulates the four-micro-detection system in the laser semi-active pilot, which effectively assesses the performance of the system and provides the basis for the design. At the same time, a laser dispersion analysis was carried out, providing a theoretical basis for system design and optimization。
In addition, the system's dissipation was analysed using lighttools software, which further enhanced the performance of the system. Currently, the most commonly used software for optical design analysis at the international level is code v, lighttools, tracepro, zemax, among others, where lighttools have a clear advantage in the integration of optical systems, dispersive analysis, etc。
Lighttools simulation model
1. 1 modelling of a quadrant detector
The quadrifuge detector is the main component of the detection system, and the quadrifugal detector is the four-point sequenced and integrated on the same chip by the requirements of the rectangular coordinate system of the four equally performing probes, separated by a cross line, as shown in figure 1. Figure 1 shows the diameter of the light-sensitized element of the detector, d the width of the split line, and a, b, c and d represent four light-sensitized faces, i. E., four quadrants. The quadrifuge detector has the advantage of having a high frequency of response, a wide wavelength response, a high sensitivity and a large work temperature range。
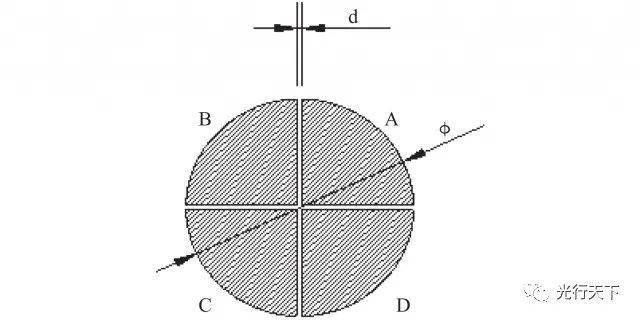
Figure 1
This is a simulation of the four quadrant detector parameters as shown in table 1。
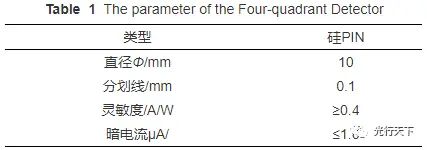
Table 1. Quadrant detector parameters
1. 2 optical system modelling
Optical systems are designed using the codev optical design software, which is highly interactive with the lighttools software and allows for direct conversion of the designed systems. Mechanical structures such as mirrors are modelled using software such as ug before being imported into lighttools and simply modified. The model is shown in figure 2。
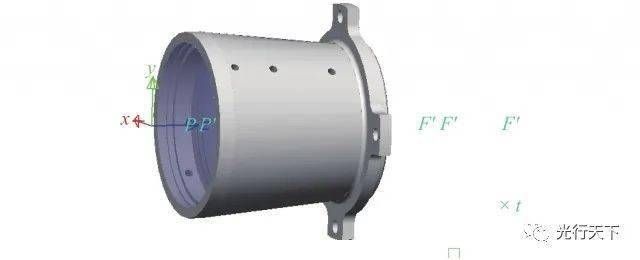
Figure 2. Optical system models
1. 3 overall modelling of detector systems
Optical systems and quadrant detectors are deployed in designated positions as required by the design. The optical system is then preceded by a light source, a simulation of the target light input and an overall model of the detection system, as shown in figure 3。
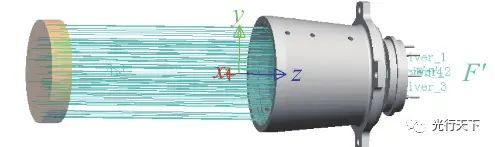
Figure 3. Model of detection systems
2. System simulation
2. 1 simulation of margin commands
For the laser quadrifugal detection system, the working time system receives and aggregates laser beams that are well-reflected from the target, forming circular light spots on the detector, which allow each quadrant to export a signal that can be signaled at the target position through the processing of each quadritic output signal。
Defines the signals of the four quadrant outputs as va, vb, vc, vd, using a margin range, which can be used to calculate location information by multiplying the deviations along y and z to uy, uz, multiplied by the coefficient k:
(1)
(2)
Through the model of the detector set up above, light will be distributed in four quadrants during the simulation process, and four quadrants of energy can be recorded and then brought into formulas (1) and (2) to calculate the system and range command output, as shown in figure 4. Figure 4 (a) is for imaging flares obtained by imitation of the system; and (b) for light spots on quadrifugal range detectors。
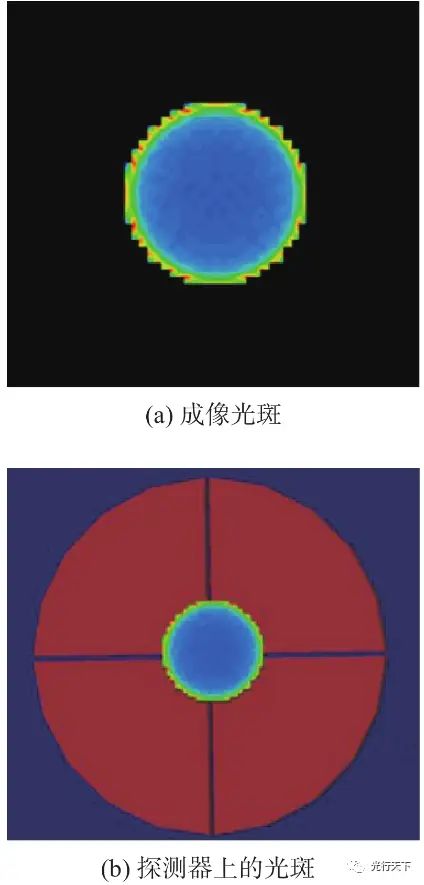
Figure 4. Distribution of light spots on detectors
By adding an energy receiver to each radius of the detector in the simulation model, energy can be collected at each range, and figure 5 is the energy value accepted on one of the ranges。
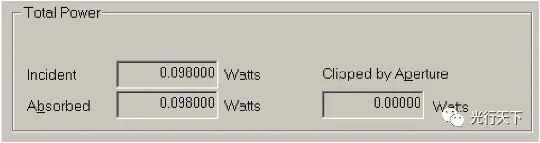
Figure 5. Energy values on a quadrant
The above analysis allows for an assessment of the system's command output and provides a basis for an overall assessment of the system。
2. 2 dispersible light analysis
Unscattered light is a phenomenon in which light in the optical system, which is normal for central africa, is reflected or dispersed several times on the detector and elicits response. The lighttools software provides a dispersive analysis function that allows for a more realistic simulation of the transfer of light into the system by setting different optical and mechanical surfaces, thus further analysing the dispersion distribution of the system. The light trail in the optical system is shown in figure 6. Figure 6 shows (a) for optical systems to conduct dispersible photoanalysis, the optical system field of view is ± 15° and the linear area is 6°, using three-formula penetrating structures; and (b) transmissions to 30° light into the optical system. As can be seen from figure 6, although the light reflected and refractioned several times in the system, there was no light on the detector, and that angle did not produce scattered light。
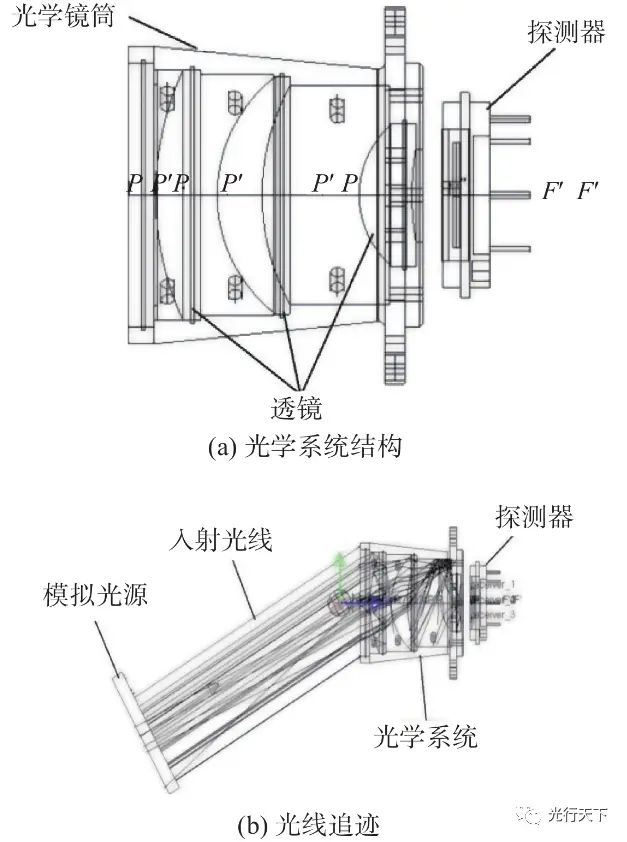
Figure 6. Light trails in optical systems
During the design process, a comprehensive simulation of the system will be performed from different angles. When there is scattered light at an angle, the light will fall on the detector. The optical system of the above chart is simulated and, when the light is 16°, a number of light falls on the detector, as shown in figure 7. The energy formed on the detector at 0° light input is 0. 5 w, and the energy formed on the detector by this fraction of dispersible light is 3. 2 x 10⁻⁷ w。
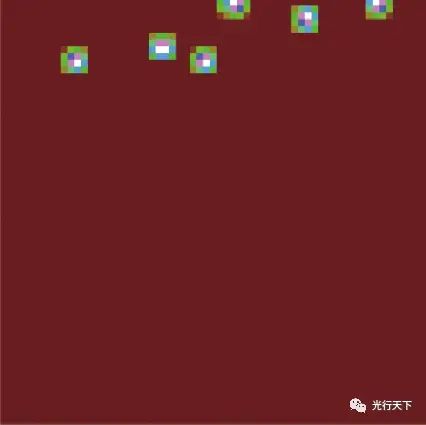
Figure 7. Lights falling on detectors
2. 3 scattered characterization simulation
The laser is very relevant and susceptible to interference, and when the laser is exposed to the object's perforated surface, or through a transparent permutation body, it produces an irregular distribution of bright marks, i. E. Laser dispersion, on its surface and in the surrounding space. This is an interventionist phenomenon, and it is present objectively in various laser systems. Therefore, this paper analyses the impact of the scatter effects on command output using lighttools software。
Based on the characteristics of the dispersion, this paper uses the lighttools software to simulate the dispersion effect by supersing some random changes on a flat light spot, as shown in figure 8. Figure 8 shows (a) the flat spots simulated for the software, and (b) and (c) the spots that increase the dispersion effect。
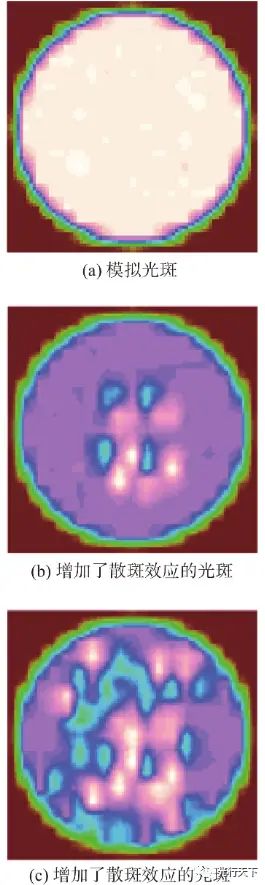
Figure 8. Laser dispersion effect simulation
Assuming that the dispersion is different at different frames, a random simulation of 10 frames of different dispersion images is carried as shown in figure 9. These 10 frames and ranges are shown in figure 10。
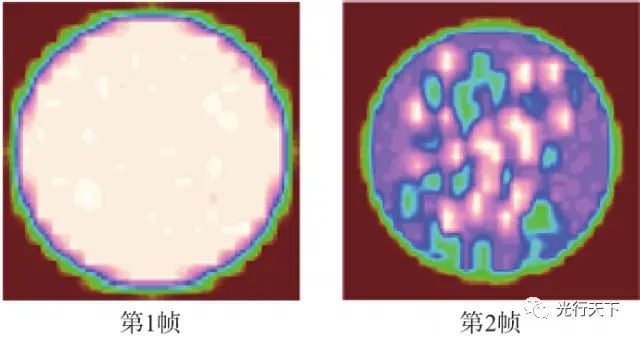
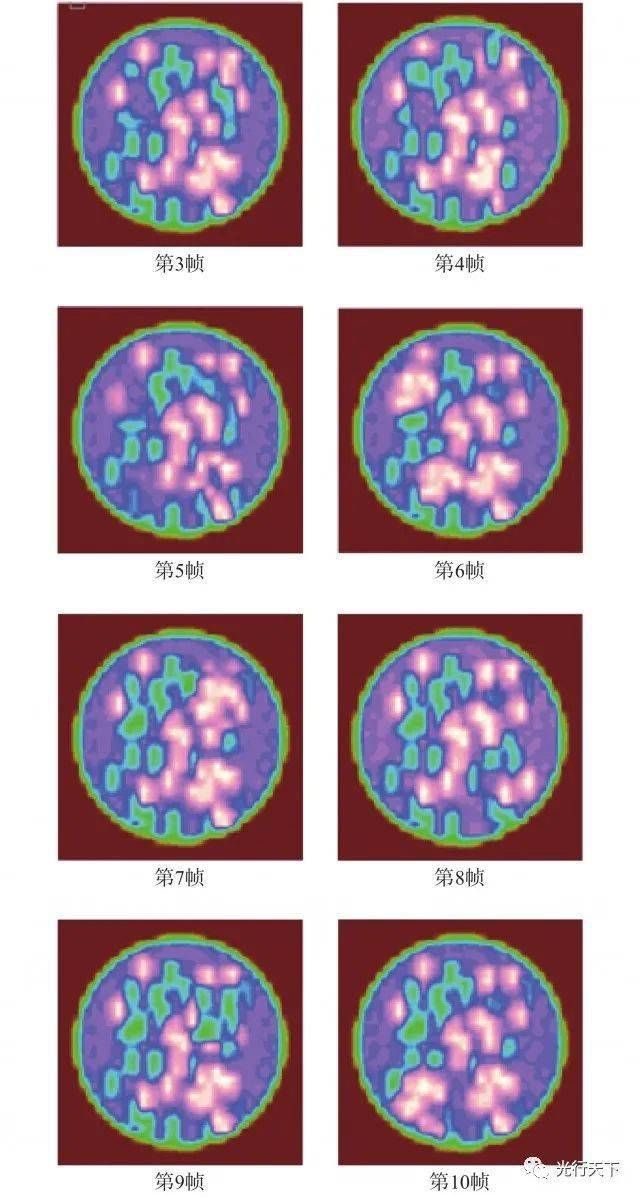
Fig. 9 scattered images of different frames
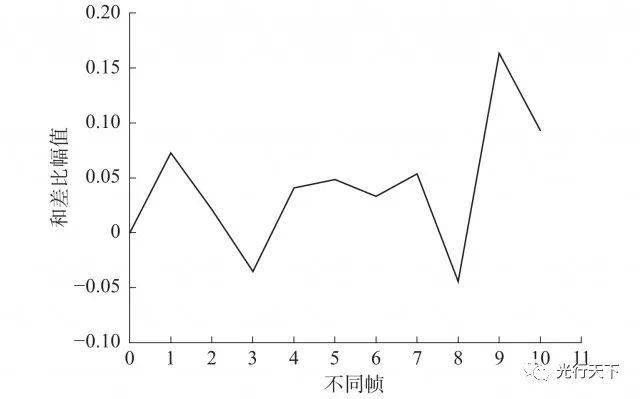
Figure 10. Time and margin ranges for different frame-scatter images
3. Test certification
The lighttools simulation model is created by the above method, i. E. The sum range of the system output in the range of 15° visual field, as shown in figure 11。
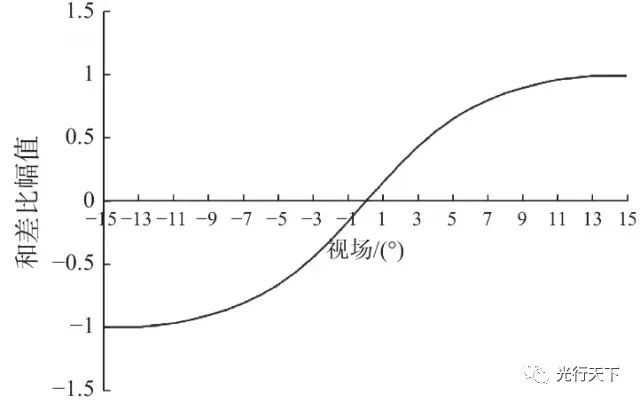
Figure 11
At the same time, a physical system is being installed in the laboratory to validate the simulation results, as shown in figure 12。
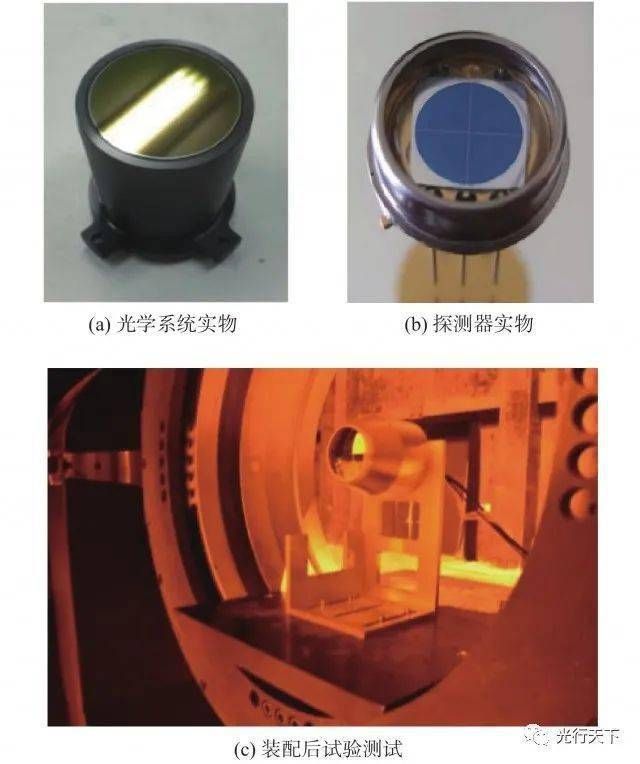
Figure 11. Experimental systems and sites
The detection system is installed on the transfer stage at the time of the experiment and is rotated along with it. The transfer is conducted one time for each 1° data acquisition, and the movement range is ± 15°, and the experimental data obtained are shown in figure 12。
Comparative figures 11 and 12 show that the values of the margin bands out of each field of view are broadly consistent and validate the simulation model。
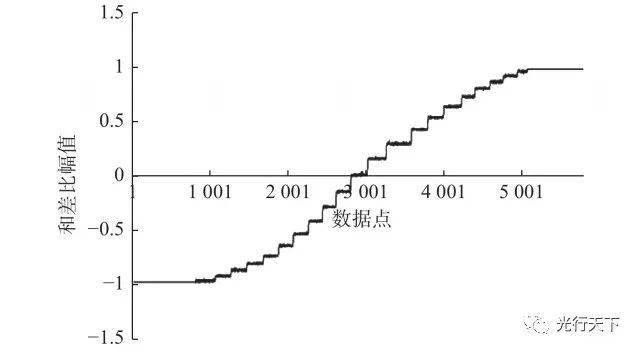
Figure 12
Conclusions
A model for a laser quadrifugal detection system was completed using lighttools software, which included a laser target model, a laser optical system model and a laser quadrifugal detector model. At the same time, the sum-band simulations within the range ±15° were completed on the basis of this model. The validity of the model was validated by comparing the results with the results of the experiments. In addition, model simulations can provide an accurate basis for subsequent optimization and improvement by assessing performances such as fragmentation of systems. The simulation methodology presented here, based on lighttools, is accurate and effective, facilitating further improvements in design accuracy and shortening the development cycle of the system。