The main force of a wave of markets, repeated shocks and bottom-to-bottom rebounds are the main cost ranges, with high concentration, and when markets rise, the chips begin to shift slowly towards distribution. When the minimum cost range disappears, the market will enter high-risk areas. The concentration peaked, and most was realized. The rest are fleeing without cost, creating a market collapse。
For example, there are only 10 holders of a certain share. The respective holding value is: us$ 1,5,51. 1,5. 2, 5. 5, 6,6. 2, 6. 9,7. 10. So, the $1 and $10 at the end, 80 per cent of the cost is between $5 and $7. Concentration refers to the proximity of the cost of these chips, and the smaller the concentration value represents the proximity of the cost of the chips。
The calculation is divided by the area of cost (high and low) divided by (high and low). Changed the holding value above: us$1,5,5,5,510. At 80 per cent of the cost of the unit, the chips are the same and the concentration is zero. The impact of this position on equity prices, whether in terms of support or pressure, is significant。
Extension
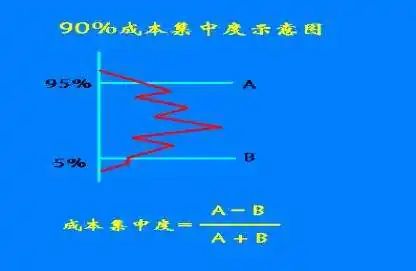
Cost concentration is an important value, theoretically between 0 and 100. The smaller the concentration, the more cost the equity chips are, the more it is, the lower the mobile cost distribution, where the 90 per cent cost distribution, for example, is presented. In the chip distribution, 90 per cent is removed and the rest is 10 per cent
This 10 per cent is divided into two 5 per cent, one 5 per cent is the top of the chip map and the other 5 per cent is the bottom of the chip map. For these two 5 per cent, there are two price positions, one higher and one lower, and the margin between the two is cost concentration. In short, if the higher price is a and the lower price is b, the cost concentration is (a-b)/(a+b)。