Summary: the fragmentation and invisibility of knowledge in the business knowledge base have long constrained the depth of knowledge services. Knowledge mapping, as the core technology for structured knowledge expression, provides an effective path to address the problem. This paper system combes the four types of down-the-ground form of the knowledge map in the enterprise knowledge base - the body map, the physical relationship map, the event chart and the flow chart - by comparing the dimensions of the description of the object, the construction method, the reasoning ability, etc., and by proposing a multi-layer spectrometry structure. Studies have shown that the four types of mapping are positioned and that the selection of the wrong pattern will significantly reduce the effectiveness of the application; and that the enterprise selects the right type of mapping based on core needs to avoid errors in "one type of mapping solves all problems"。
Key words: knowledge mapping; business knowledge base; home mapping; event mapping; flowchart spectrum
Introduction
Over the years, the enterprise knowledge base has been built up and document storage and retrieval capabilities have improved significantly, but the pain of "knowledge fragmentation, invisibility" remains prominent. After the user retrieves the relevant document, it is still necessary to collage the information in multiple documents to get the complete answer. Knowledge mapping (knowledge graph, kg) provides a straight answer to integration by structured mapping entities, concepts and relationships that enable the system not only to locate documents, but also to understand inter-document relationships and support reasoning。
However, many enterprises, when introducing knowledge maps, see them as a single technology and try to solve all problems with a single set of maps, leading to a significant underperformance of applications. In practice, the knowledge map has four different forms in the business landscape - the body map, the physical relationship map, the event chart and the flow chart, each of which addresses different dimensions, each with its applicable scene and construction path。
This paper aims at systematically combing and comparing these four patterns to inform the selection and implementation of enterprise knowledge maps。
Gpt image 2 generation
2 relevant research and theoretical foundations 2. 1 definition and development of knowledge mapping
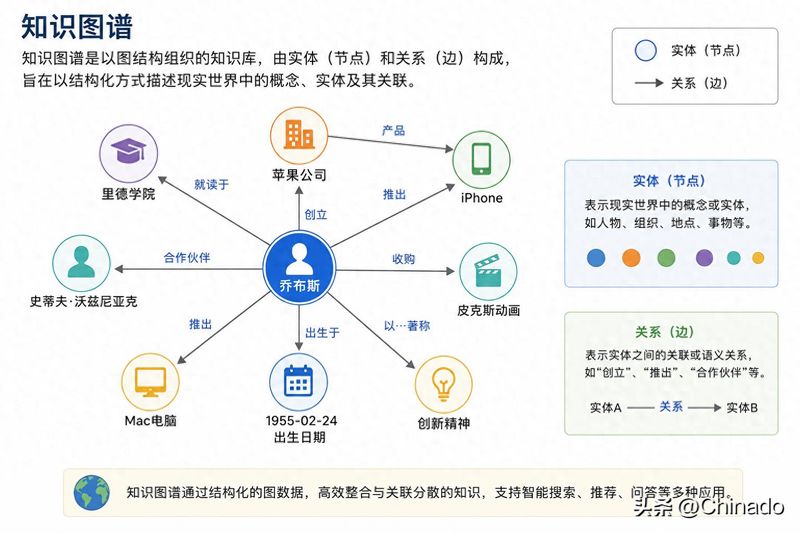
The knowledge map is a structured knowledge base consisting of entities (nodes) and relationships (sides) designed to describe in a structured manner the concepts, entities and linkages in the real world. Since google introduced the concept of knowledge mapping in 2012, the technology has been expanded from the general domain (wikidata, dbpedia) to the vertical sector。
2. 2 spectrotype basis
The knowledge map can be divided into sub-types depending on the object of the description and the degree of abstraction. In the academic world, the ontology focuses on formalizing definitions at the conceptual level, with case-level maps focusing on the description of specific entities and facts. In business practice, a further distinction needs to be made between event-centred and process-centred flow-mapping, which constitute the complete type-species of enterprise knowledge-mapping。
2. 3 industry trends
Gartner predicts that 80 per cent of enterprises will adopt graphic technology in 2025. This trend suggests that mapping technologies are moving from research to scale, but the choice of landing patterns remains a key challenge。
3. Patterns and characteristics of the four types of knowledge map 3. 1
This is the most abstract type of knowledge map, which does not describe specific facts, but rather relationships and rules between concepts. This schematic defines the "constitutional" of business knowledge - core concepts (equipment, components, malfunctions, people, processes, etc.), conceptual relationships (equipment contains components, malfunctions affect equipment, etc.) and binding conditions of relationships (each equipment contains at least one component, each malfunction must have its cause, etc.)。
The following is an example of a manufacturing home map:
Concept (category):
ideas - devices
♪ i miss ♪ ♪ pressure machine ♪
ideas - a noter
welding machines
ideas - parts
ideas - bearings
ideas - electric
│ └ transfer belt
ideas--fault.
♪ i miss — it sounds ♪
i miss - overheating
─ ─ stop! Personnel
the maintenance engineer. Ideas - operators
quality examiner
relationship (relations):
ideas - device - contains - > widgets
ideas--parts--incident---
idea--fault-- causing--
ideas - personnel - maintenance - > equipment
personnel - operation - > device
binding (rules):
idea - each device contains at least 1 widget
i think there must be one reason for each failure.
└ - each maintenance record must have one responsibility people
3. 1. 2 core competencies
1 uniform terminology: different sectors may have different terms for the same concept (r & d, "roll bearing", production, "axis", procurement, "bearing"), and this body chart eliminates ambiguity by defining standard terms。
2 constraint data quality: when new data are entered into the database, the body chart can check compliance with binding rules and automatically warns if the failure record is missing。
3 in support of reasoning: the underlying reasoning can be based on in-house rules, such as "m001 contains a bearing" + "m001 may sound"。
3. 1. 3 application of scenery and construction
The applicable scenarios include a standard regulatory system (standardization of industry terminology, structuring of statutory provisions), data governance (harmonization of data models, regulation of data quality) and a knowledge classification system (construction of an enterprise knowledge classification framework)。
The construction method usually requires the involvement of experts in the field, including conceptualization, relationship definition, binding rule-making and tools (e. G. Protégé, neo4j, etc.). This is both its advantage (precision) and its disadvantage (high cost)。
3. 2 entity relationship mapping: who has a relationship with whom 3. 2. 1 definition and structure
The entity relationship map records the specific relationship between the entity and the entity, which corresponds to the "house registration file" of the enterprise. For example, m001 presses use the x-axis bearing model, zhang zhang is responsible for maintaining the x-ray m001 press, and the manufacturer y zheng supplies the x-axis bearing model。
Example of entity relationship pattern:
Entities:
idea - m001 press (type: equipment)
ideas - axle bearing type x (type: widget)
idea - zhang siu (type: maintenance engineer)
ideas - vendor y (type: supplier)
ideas - 2026-05-28 (type: time)
└ - sop-2024-008 (type: protocol)
relationship:
ideas - m001 - usage - > axis type x
ideas - m001 - last week maintenance - replace bearings
ideas-- replacement bearings-- operator--- zhang san
ideas - axis type x - vendor - >producer y
ideas-- improper installation of bearings-- causing--
└--voice-- >checking method-- > checking installation twists
3. 2. 2 core competencies
1 quick location correlation information: the user asks "who supplied the m001 bearings" and the map can go directly through the m001 → bearing model x → supplier y, without full search。
2 discovery relationships: surprising correlations were detected through mapping analysis, such as the "axis supplied by manufacturer y" which suffered 12 malfunctions over the past six months "zhang 3 maintenance equipment with a 30 per cent lower failure rate than the average"。
3 in support of complex queries: "find all equipment supplied by manufacturer y" - such queries are difficult to achieve in document retrieval, but only once in the diagram。
3. 2. 3 application of scenery and construction
The applicable scenes include the customer relationship management, supply chain management, organizational architecture management, equipment asset management, etc。
Build can be achieved by automatically extracting documents: name entity identification (ner) links extract entity link spectroscopy construction. Automatic extraction is usually between 70 and 85 per cent and relationships in critical areas are manually reviewed and amended。
3. 3 incident mapping: what happened, why 3. 3. 1
The pattern of events focuses on "incidents" -- when, where, who, what, what. The core structure includes events, time, location, participants and causality。
Example of event pattern:
Event 1: m001 arguments
ideas - time: 2026-06-05 1430
idea - location: workshop a
ideas - participants: m001 press, bearing x
ideas - reason: improper installation of bearings
└ consequences: production suspended for 2 hours
event 2: m001 bearing replacement
ideas - time: 2026-05-28 0900
idea - location: workshop a
ideas - participants: zhang san, m001 press
ideas - replace parts: axis type x
└ results: return to normal operation
event 3: axle bearing x batch mass problem
ideas - time: 2026-03-15
i-participants: maker y, bearing x
ideas-question: batch hardness not met
└ impact: 30% reduction in the lifetime of the batch
causation chain:
events 3 (volume quality issues)
there's a risk to the re-engineered bearings in event 2.
• lead to incident 1 (inverse)
3. 3. 2 core competencies
1 broken root cause analysis: incident mapping can be traced back along the causal chain, as demonstrated by the failure to pass the test, as demonstrated by the zhang tsang training record of the installation of the acoustic bearings。
2 trends: analysis of historical event sequences predicting future events, such as "use of equipment supplied by manufacturer y, with a failure rate twice the average"。
Retroactivity of liability: when a problem occurs, the chain of responsibility of the operator, the maintainer, the supplier, the approving officer can be traced quickly through the mapping of events。
3. 3. 3 applicable scenery and construction
Applicable scenarios include failure diagnosis and root cause analysis (manufacturing, energy, transport), security incident management (chemical, mine, construction), case analysis (public security, courts, compliance), business process optimization, etc。
The construction method combines time-series data: the event extracts time to match the cause and effect reasoning pattern. Corresponding relationships are often unclear, need to be combined with field knowledge reasoning and are more difficult to construct。
3. 4 flow mapping: how things should be done 3. 4. 1 definition and structure
The flow chart describes the "process" — the dependencies between the steps, the requirements and the steps required to accomplish a given task. The core structure includes processes, steps, sequencing, conditions and roles。
Example of flow chart (m001 bearing replacement process):
Step 1: shut down and power out
ideas - executing role: operator
ideas - precondition: m001 = run medium
└-- output: m001 status = stop
step 2: dismantling old bearings
ideas - implementation role: maintenance engineer
ideas - tools: axes racing, wrench
ideas - checkpoint: any abnormal wear on the bearings
└-- output: old bearings dismantled
step 3: clean axle bearings
ideas - implementation role: maintenance engineer
ideas - tools: cleaning agent, dustless
idea-standard: no oil on the surface, no scratches
└-- output: axes cleaning complete
step 4: installation of new bearings
ideas - implementation role: maintenance engineer
ideas - tools: twisting wrench
ideas - key parameters: twisting 45-50 n. M
ideas - inspection point: axle bearings smooth and uncarded
└-- output: new bearing installed
step 5: test run and accept
ideas - executing role: operator + quality tester
ideas - test project: 30 minutes running, monitoring temperature, vibration, noise
ideas - acceptance standard: temperature
3. 4. 2 core competencies
1 intelligent guidance: when new staff perform maintenance tasks, the system provides real-time alerts on current steps, key parameters, detection tools and common problems。
2 process optimization: analysis of the implementation of historical processes reveals bottlenecks, such as "step 4 takes an average of 45 minutes, which is three times longer than other steps" and "30 per cent of back-to-work takes place in step 5"。
3 compliance inspection: automatic inspection of process implementation compliance, e. G., "step 4 does not record rectangular values and does not meet the requirements of sop-2024-008"。
3. 4. 3 application and construction
The applicable scenarios include standard operating procedures (manufacturing, medical, laboratory), business process management (approval process, procurement process, project management), training and appraisal, quality control, etc。
The construction method is extracted from the existing sop document: the step identification sequence extracts the parameters of the role binding. As the sop document itself is structured, the flowchart is constructed in relative norms。
3. 5 comparison of 4-type maps with option 3. 5. 1 core differences
Dimensions
Beneath
Entity relationship map
Event profile
Flowchart
Description
Concepts and rules
Specific entities and relationships
Specific events and causes and consequences
Processes and steps
Abstract
Most abstract
Specific
Specific + time series
Specific + logic
Build with
Manual definition
Automatic extraction + manual clearance
Automatic extract + reasoning
Extract from sop
Maintenance costs
The ability to reason
Conceptual reasoning
Association queries
Paradoxically
Process guidance
Typical queries
"what components do the equipment contain?"
"who's the supplier of m001?"
"what's the root cause of the m001 failure?"
"what's the next step in changing the bearing?"
3. 5. 2 choice of decision-making
The selection of graph types should be based on core needs: harmonization of terminology and definition of the concept system for the selection of body profiles; identification of entity relationship profiles for the selection of entity relationships; analysis of event causality and retroactive root event profiles; and guiding process execution and optimization of business process selection flow profiles. If the demand covers multiple dimensions, it should be combined to build a multilayer spectroscopy structure。
3. 5. 3 multilayer spectroscopy configuration
In large enterprises, there is usually a need to combine multiple maps:
│ application layer
smart questions and answers / failure diagnosis / process guidance / compliance check │
i'm sorry. What happened?
• physical relationship mapping (who has a relationship with whom)
i'm sorry.
│ flowchart (what to do)
i'm sorry.
│ body map (conceptual definition)
It defines at the bottom all concepts and rules; the standard operation of the flowchart description; the physical relationship spectra records specific persons and objects; and the event spectra records events and causality。
4 conclusions and outlook 4. 1 core findings
Knowledge mapping is not a single technology, but a technological spectrum that encompasses four types of form. Consistency and rule definition of the heretic spectrometry solution, entity spectrometry resolution of associated queries and hidden relationships, event spectrometry resolution causal reasoning and causal analysis, flow spectrometry resolution operational guidance and compliance inspection. The wrong pattern would result in a significant discount on the application, and enterprises would have to choose the appropriate pattern type based on the core issues。
4. 2 elements of practice
Businesses with a clear sop file usually start with a flowchart (with low difficulty in extracting it and having quick results); enterprises with complex equipment/product systems start with a physical relationship profile; enterprises facing terminological inconsistencies start with a home-based profile; and enterprises requiring trouble cause analysis start with an eventchart (with at least six months of event data accumulation)。
Common practice points: one type of mapping does not solve all the problems; it is validated from the core business areas and then expanded; continuous maintenance of the mapping is essential; critical areas of relationships require manual review and cannot rely too heavily on automatic extraction。
4. 3 description of the scope of the study
The discussion in this paper of the four categories focuses on morphological characteristics and selection guidance, and the specific construction algorithms and assessment methods for each category are not explored in depth。