Theory of volume prices — theory of stock market energy
The quantitative theory is to analyse the relationship between turnover and stock prices, and to speculate on post-market trends using signs of increased or reduced turnover. Its inventor was the famous united states financial columnist and investment spokesman, granby, and the theory was published in the book stock market indicators。
Grange sees trade as an inherent factor in stock-market volatility, a direct indicator of whether stock-market transactions are active and human, contributing to stock prices. Whether or not stock prices will continue the previous trend is entirely dependent on the turnover being able to continue or surpass the previous level。
If the market is not backed by turnover, stock prices will remain at their original level and will fall even lower. And as the turnover rises, the huge turnover usually leads to signs of a shift from bear to cow, a change that is already well known. Gramby's quantum theory has several aspects。
1. Price increases
It is very easy to understand that the rise in volume prices, which tends to lag behind the increase in turnover each time a big cow market or a shift from bear to cattle market, can only be a sign of the emergence of cattle markets if there is a significant increase in turnover and most stock prices rise。
As can be seen from figures 2-8, we can see in the map of the performance of gill power (000543), which at the beginning of february 2015 was characterized by a parallel increase in the volume of gill power exchange and stock prices, both of which also bode well for a reversal in the market。
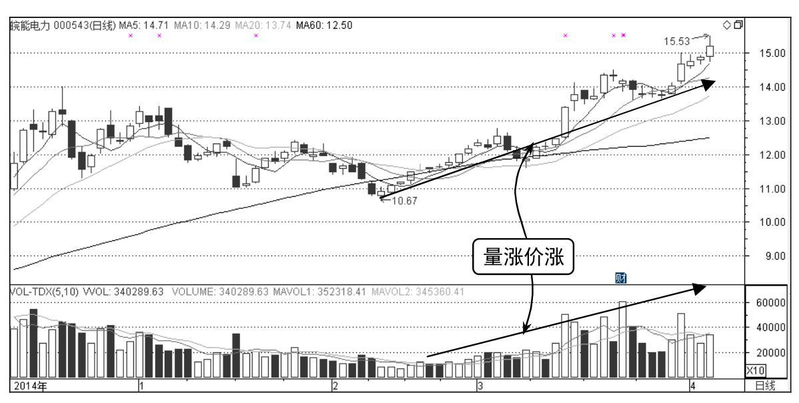
Figure 2-8 trade growth and stock price increases
2. Increases in volume and innovation
As stock prices rise, it is inevitable that large amounts of capital will be required to buy large shares in order to sustain this upward trend. The fact that equity prices have reached new highs and that money does not enter markets in large quantities, rather they remain close to an average line, indicates that shareholders already feel high in terms of current equity prices and are less eager to buy in, which is a precursor to suspicious trends。
As shown in figures 2-9, we found that the gold round shares (000546) rose continuously at the end of march 2015, and that the turnover continued to rise as stock prices rose, stimulating a short-term rise in stock prices, but by the beginning of april the stock price had reached its recent peak, yet there had been no significant increase in the turnover for the days before, suggesting that the latter city should be alert。
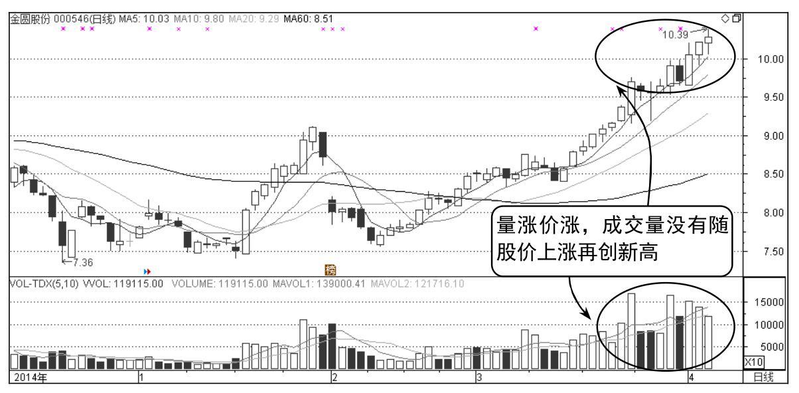
Figure 2-9 merchandise is a key factor in supporting new and higher equity prices
3. Declining prices
The stock price rebounded with the decline in the turnover, indicating a lack of momentum for stock price increases and a reversal of stock price trends. This situation is not uncommon in the stock market, especially when the overall trend is positive, and this price increase falls very rarely。
This contradictory trend, however, is evident in individual large capitalizations, which are mostly in the hands of agencies, which operate in a more disciplined manner。
As can be seen from figure 2-10, a new low of $29. 44 was collected by the gangbell vehicle (000550) on 30 december 2014 and then entered 2015 when stock prices began to rise sharply. Equity prices have been rising throughout january, but the turnover has been shrinking, showing a downward trend。
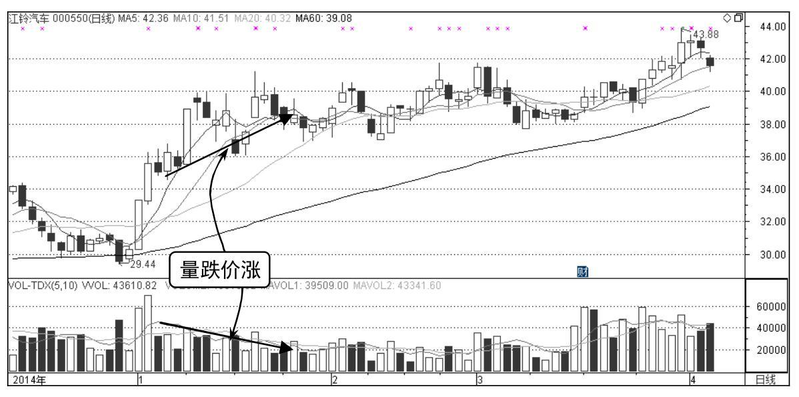
Figs. 2-10 stock prices return with trade-off litres
4. Declining price increases
Stock prices are rising gradually as the turnover increases, and if the turnover suddenly increases several times, the stock price rises significantly, followed by a severe contraction and a sharp fall in the stock price, indicating that the increase has reached its final stage and that shareholders are better off to watch. On the other hand, the stock price has reached the bottom and the best entry opportunities for shareholders have come。
As can be seen from figures 2-11, the high new developments (000628), which rose from $9 to $13 at the beginning of november 2014, increased by more than 40 per cent. This madness, of course, is in keeping with the popularity of many “hot” shareholders。
When the stock price was close to $13, it had been maintained for only two days, and there had been a marked contraction in the trade, which was the end of the increase, at which point the shareholders should have been paid off. Otherwise, from $13 all the way down to $8, the stockholders would really feel the sense of "crazy rice mice" in the playground。
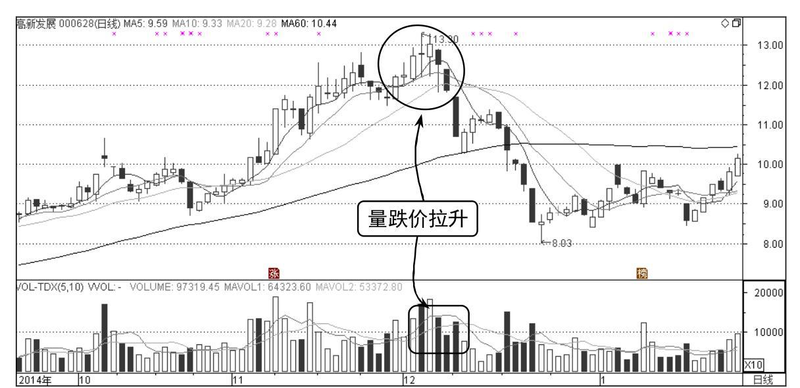
Figure 2-11. Reduced turnover also affects stock prices
5. Deviation of share prices and turnover
The longer the stock prices and turnover go, the greater the chances of a subsequent market decline. If there is a sharp drop in turnover at this time, even if the stock price continues to rise, it would be futile to fall to a lower level. Stock prices, which are not supported by trade, are a dangerous signal。
On the other hand, there is a large trade in lows, which, if there are small fluctuations in stock prices, presages for shareholders to choose entry opportunities, as large trades presages for the dealer or market to start slowly。
This is similar to the fourth point, but the fourth point is a sharp increase in the turnover, while the fifth point is a slow increase, and then a sudden reduction makes stock prices unsupported by the market. This situation is very rare in the stock market and is difficult for shareholders to meet, so it is not repeated here。
6. Signs of inverse intermingling
The decline in stock prices is to be judged in conjunction with the evidence of a real reversal of the turnover, which, if the turnover does not increase significantly, may be merely a trickle-down and, if the turnover is continuously amplified, it usually suggests that the efforts of multiple parties are beginning and that shareholders should take advantage of the opportunity to make a profit。
As shown in figures 2-12, the previous peak cement (000672) showed a steady downward trend in january 2015, with signs at the bottom in mid-january, followed by a brief rebound in stock prices, but this rebound did not last long, lasting just over a dozen trading days, and the stock price began to show a clear downward trend。
For that reason, we have found that stock prices have remained low at the bottom during the rebound, without a clear trend of growth, reflecting the market's lack of appreciation for this short-term rebound, which, having become “apathy” of the unit, will only continue to decline in the direction expected by the market。
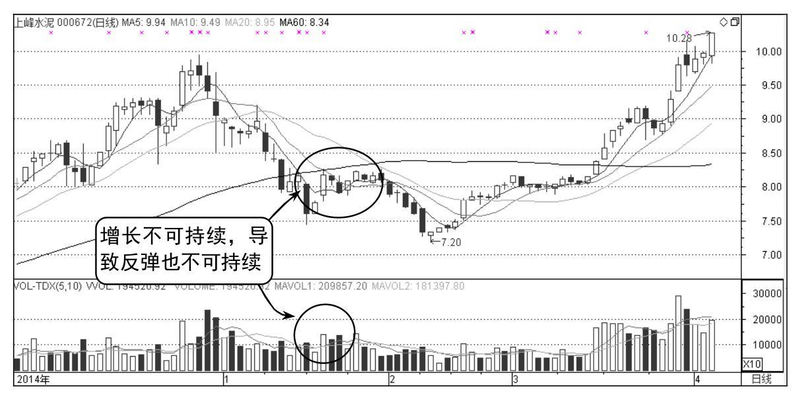
Figures 2-12. The sudden increase in the turnover does not mean that stock prices will also reverse
7. Reactions to the whole bottom plate are subject to exchange
In the course of falling stock prices, there are clear signs of bottom-set consolidation, and when rebounding, attention must be paid to the volume of the trade, and if the rebound does not show signs of a surge in the trade, it is advisable for the shareholders to continue to wait until the trade is clearly contained。
As can be seen in figures 2-13, visual china (000681), which began a downward trend in december 2014, has continued to decline in stock prices, but this turnback has been successful at the bottom, with two notable phenomena: first, the unit has had a narrow shock between $20 and $25, and the bottom of the stock price has gradually developed; and second, during the rebound of the unit, the turnover has risen as stock prices have risen and the rate of growth has exceeded the rate of stock price rise, indicating that the market is optimistic about the future of the unit, which is usually a relatively stable and sustainable rebound。
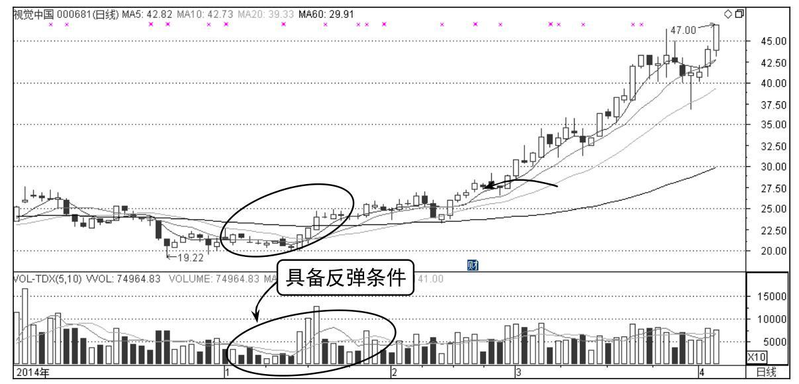
Figure 2-13. The trade-off variation meets the rebound requirement, which means the stock price is also reversed
8. Exchanges and averages combine to influence stock prices
Whether or not stock prices continue to fall below the trend line of the long-term movement average (usually 20 and 60 days) must be judged primarily on the basis of exchange, and only when there are large rolls will it be clear that the decline is the beginning of a long-term decline, otherwise it is a sign of a short-term decline。
As shown in figures 2-14, during the great fall of qinghai minghe (000606), at the end of december 2014, when stock prices fell by the 60-day average, the turnover remained high in the preceding period, and remained stable as stock prices continued to decline, suggesting that the decline had become the norm, that there could be no significant improvement in the short term, and that there might be a further sharp fall in stock prices, which was confirmed by the subsequent trend, which had dropped from $7. 9 to close to $6, and that the shareholders had suffered heavy losses。
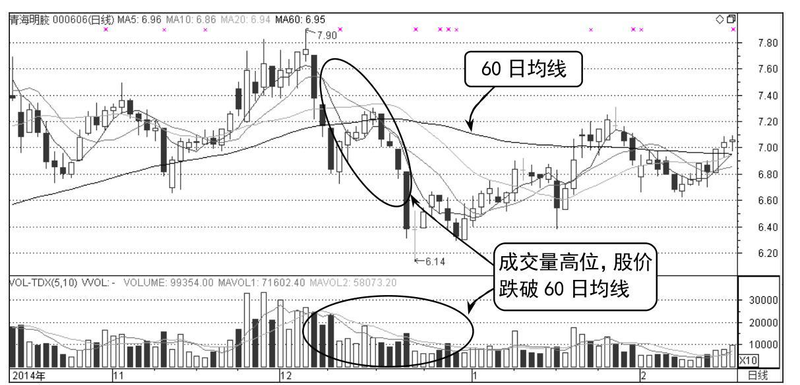
Figure 2-14 exchanges and meanlines affect stock prices
For the first time, grange's quantum theory links the trade and stock prices to an indicator, the obv indicator that we have described. However, the obv indicator does not fully reflect the growth of the traded amount, so shareholders must use the volume price theory in combination with the candle map and the transactional amount. This is why the obv indicator is only a supporting indicator, although it is the first to be combined in quantitative terms, it is still not a substitute for the role of the barometer and candle map。
Grant's introduction
Grange is not a professional securities analyst, but a financial columnist and investment spokesman. It is similar to the many columnists now on the internet。
The most famous thing was not his invention of the theory of volume prices, but his many predictions of possible stock market collapse in 1970, 1980 and 1990, which, although never happened, entered a downward cycle. Gramby, though inaccurate in his predictions, was also a well-known personality in the stock market at that time。
In the last decade, domestic research into the theory of volume prices has been slow for a number of reasons, most notably because of the complexity of market information and the fact that even when shareholders study stocks in a way that combines them at a volume price, there is much that is not known when it comes to determining whether stock prices are rising or falling。
However, according to the writer's experience, medium- and long-term stock purchases are judged to be more successful than short- and super-short-lined. So, if shareholders want to use the quantitative price theory to improve success rates, they would prefer medium- and long-term strategies。