What exactly is the business analysis report
Business analysis is far from being a simple aggregation of data. It is a comprehensive diagnostic and decision-support document based on the financial and operational data of the enterprise, combining the market environment, internal resources and strategic objectives through systematic analysis. Its core features are in three ways:
First, it's a dynamic diagnostic. Unlike static financial statements, business analysis reports emphasize trend analysis, comparative analysis and structural analysis. It not only answers “where we are now”, but also reveals “how we got here” and “where we are moving”. For example, through a continuous quarterly trend in māori rates, combined with an analysis of product distribution structures and cost changes, the real drivers of profitability fluctuations can be precisely identified。
Second, it's a multi-dimensional lens. A full report contains at least four dimensions: financial dimensions (profitability, solvency, operational efficiency), customer dimension (market share, customer satisfaction, cost of access), internal process dimension (production efficiency, process cycle, quality control) and learning growth dimension (staff skills, innovative inputs, system building). Together, these four dimensions form an overall picture of the health status of the enterprise。
Third, it's a strategic decodor. The report translates high-level strategies into specific indicators that can be understood and implemented across sectors. When companies are strategically positioned in “differentiated competition”, the report focuses on indicators such as r & d input output ratio, revenue share of new products, customer perception value, etc., to ensure that the strategy remains on track。
Why: the irreplaceable value of business analysis reports
In the management of business operations, the value of business analysis reports is not “additional” but “blowing carbon in the snow”. It protects enterprise development from multiple dimensions and serves as a key link between strategy and implementation, problem detection and problem solving。
Provision of a “dashboard” for strategic landings to calibrate direction
Business strategies tend to be macro- and long-term, while business analysis reports decompose strategic objectives into quantitative, phased indicators that visualize the progress and effectiveness of strategic landings through data such as regular tracking of revenue growth rates, target achievement rates, etc. If a business block battalion continues to grow at a slower rate than strategic expectations, the report can provide a timely early warning, prompting managers to reflect on strategic positioning deviations, underinvestment of resources, or sudden changes in the market environment, thereby adjusting strategic direction in a timely manner and avoiding a “south-south divide”。
Providing a “think tank” for business decision-making to reduce trial error costs
Managers who face decisions such as business expansion, product upgrading, cost control and so forth are vulnerable to mistakes in “head-to-head” decision-making when judged by experience alone. Business analysis reports provide data support for decision-making through trend analysis of historical data and simulation of the effects of different programmes. For example, when an enterprise plans to introduce a new product, the report can predetermine the market potential of the product by analysing sales data for the same product, the consumption habits of the target audience, the matching of costs with pricing, etc., helping managers to judge whether and how to price it, thereby reducing the risk of decision-making and the cost of error。
Providing a “microscope” for internal management to improve operational efficiency
The business analysis report focuses not only on the external market but also on the various aspects of internal operations. By analysing the cost structure of the production chain, problems such as waste of raw materials and backwardness of processes can be identified; by analysing the channel data of the distribution chain, efficient channels and inefficient channels can be identified and resource allocation optimized; and by analysing the manpower cost-output ratio of the management chain, team effectiveness can be judged to be satisfactory. These detailed levels of analysis, like the microscope, leave the gaps in internal management intact and provide a specific grasp for lean management。
Provision of an “early-warninger” for risk prevention to avoid an operational crisis
The outbreak of business risks is often not without warning, but is gradually manifested through data changes. The business analysis report provides early warning of potential risks through continuous monitoring of key risk indicators (e. G. Asset-liability ratios, net cash flows, stock turnover rates, etc.). For example, there may be a risk of cash flow strain if the enterprise's liquidity rate continues to decline, suggesting a reduced fund recovery capacity, and if the stock turnover rate is significantly reduced, there may be problems of product de-sale and over-exploitation. The timely detection of these signals can help enterprises to respond early and avoid crises。
Iii. A hands-on path: how to build high-quality business analysis reports
The production of a truly business analysis that drives decision-making requires a systematic approach and rigour. The following framework may be consulted:
Building the “strategic-indicators” nexus
Reporting indicators must be directly linked to strategic objectives. A balanced scorecard framework is used to translate strategic themes into specific indicators. For example, if the strategic focus is on “increased customer loyalty”, the report should track such indicators as buy-back rates, net recommended values (nps), customer life-cycle values, and not focus solely on new clients. Each indicator should have a clear formula, data source and tracking frequency。
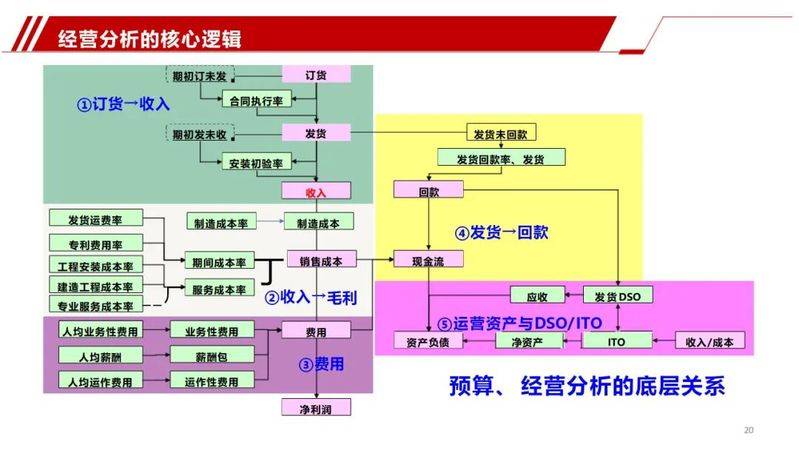
Implementation of the “three-layer incremental” analysis
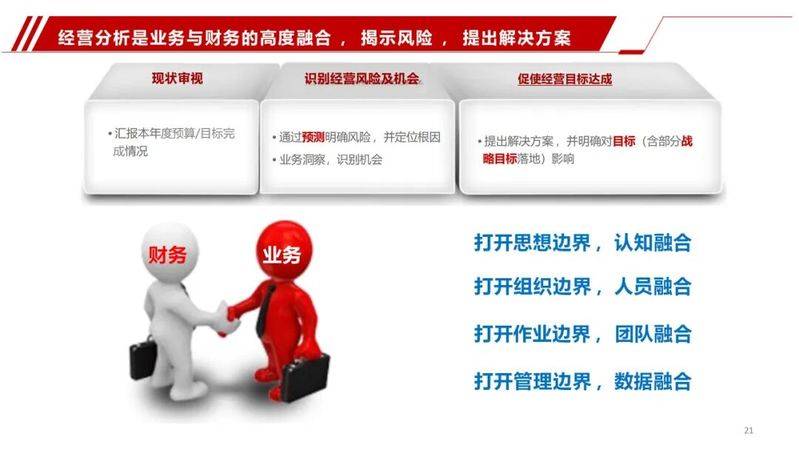
Fostering an integrated “business-finance” perspective
Good business analysts must bridge the gap between finance and business. When analysing the decline in the māori rate, it should not be attributed solely to “cost increases”, but should explore in depth: are the price fluctuations in the raw materials market? Vendor change? Production process issues? Or did changes in product design lead to increased material use? This retroactivity often reveals business problems that cannot be directly reflected in the financial statements。
Knowledge of the art of “storyization” presentation
Data per se do not speak, and analysts need to give them narrative logic. Use of the “question-analysis-settling” storyline: from the point of view of key operational issues, the data layer analysis leads to clear recommendations. Visualization is also crucial, with a carefully designed dashboard sometimes outpacing 10 pages of data tables. But there is a need to be alert to visualization traps — to avoid distorting data authenticity for aesthetic purposes。
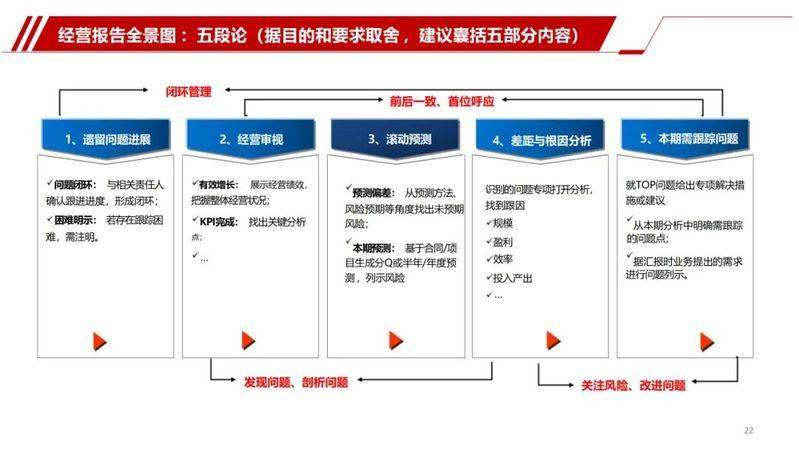
Establishment of a “closed-ring management” mechanism
The value of reporting lies in its application. A complete closed circle of “report release-decision discussions-action tracking-impact feedback” must be established. Each business analysis meeting should result in clear lines of action, the designation of the responsible person and the completion time, and a review of progress in implementation at the next meeting. This closed loop ensures that the analysis is not mere formality and is truly translated into business action。
Related materials
Guidelines for the preparation of business analysis reports (24 ppt)

.
[stamp] template for company business analysis


It's..
[case] business analysis report 2025. Pptx


.
The space is limited to a partial presentation. (sharing ppt's searching planet: business analysis guide (24 pages of ppt))

... (due to space limitations)