1. Histogram matching
In the last one, we balanced the histogram with the matlab, and in this one we match the image's histogram. In contrast to histograms, hetograms match images with a particular shape。
When too many pixels in the image are close to zero, balancing the histogram, leading to greater statistical probability, a direct map to the height of the grey, directly leading to the overall variable of the image, which does not reach the desired result, it is necessary to match the rectangular map with a specific hetogram of the altered image. Sometimes we can use the same method to keep the color of the two images。
2. The calculation process for the matching of histograms:
1. Calculates the amount of s = t(r) that entered the image according to the formula (the formula used to balance the histogram) below
2. G(z), p(z), which calculates the histogram of the template according to the same formula, is the PDF of the histogram of the template。
Order g(z) = t(r) to extract r→z, which is usually the lowest value when more than one z is satisfied。
Note: a. For greyscale l, the greyscale histogram is taken, rounded to calculate t(r) and g(z). B. Due to rounding of g (z) and t (r), it is possible that multiple zs meet the requirements for the r corresponding zs, generally choosing the smallest z values。
R→z solver: r→z indicates that for a r (for a grey-scale histogram of l = 256, r takes 0,1,2,...,254,255), find the z that meets t(r) = g(z) or, if it does not exist, find the nearest z (i. E. The corresponding z for min(abs) - g(z)). As already stated, when z is multiple, it is usually the smallest. (if only integers are taken, only one z corresponds to the r when p(r) and p(z) are not zero.)
3. The matlab code is as follows: 1. Histogram matching functions are as follows:
This matching function is heistmatching, and enters an image that needs to be matched by a histogram, a template histogram, an output that matches an image after a histogram, and a transformation vector。
When you give a template image, you need to use imhist(i) as the template histogram for the function before calling on the function. This function uses a greyscale image with a greyscale level of 256。
[image out, t3] = histmatching (image in, hist)
% histogram match (statutory) functions
% enter a greyscale image, template histogram, to match histograms figure
% the output is a greyscale image matched by histograms, which transforms the vector.
%level is greyscale
%t1 and t2 input images, the amount of variation used to balance the template histogram
%t3 is the variation vector used to enter the image matching template histogram
level = 256;
[m, n] = size (image in);
image hist =imhist (image in);
image out=image in;
other organiser
ac1 = zeros (level, 1);
t1 = zeros,'uint8I'm sorry. Ac1(1) = image hist (1);
for i = 2: level
ac1(i) = ac1(i - 1) + image hist(i);
end
ac1 = ac1 * (level-1);
for i = 1:256
t1(i) = uint8 (round((ac1(i)) / (m*n));
end
other organiser
ac2 = zeros (level, 1);
t2 = zeros,'uint8I'm sorry. Ac2(1) = hist (1);
for i = 2: level
ac2(i) = ac2(i - 1) + hist(i);
end
ac2 = ac2 * (level-1);
hist sum = sum(hist);
for i = 1:256
t2(i) = uint8 (round((ac2(i))/ hist sum));
end
other organiser
%t1 map to t2^(-1) with multiple values, select the smallest value.
% generates 256 points between 0 and 255, i. E. 0, 1, 2,... And 255 in 256 sizes group
temp = zeros,'uint8I'm sorry. T3 = t1;
for i = 1:256
for j = 1:256
temp(j) = abs (t1(i) - t2(j));
end
[~, b] = min (temp);
t3 (i) = b-1;
end
% the value of the images entered according to t3
for i = 1: m
for j = 1: n
amage out(i, j) = t3 (uint32 (image in(i, j)) + 1);
end
end
end
2. The test codes are as follows:
No, close all;
okay, clear all;
clc;
image2 = imread'2. PngI'm sorry. Image3 = imread'3. PngI'm sorry. Hist3 = imhist (image3);
metch1 = histeq (image2, hist3);
[match2, t] = histotching (image2, hist3);
i don't know, figure;
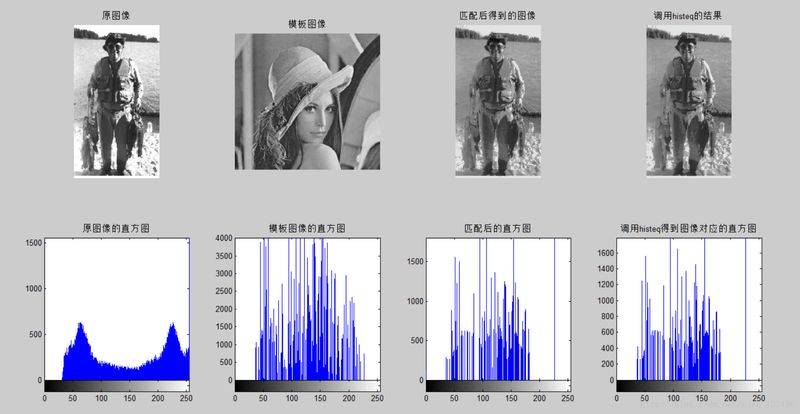
subplot (2, 4, 1), imshow (image2), title()'old imageI'm sorry. Subplot (2, 4, 2), imshow (image3), type()'stamp imageI'm sorry. Subplot (2, 4, 3), imshow (match2), title()'accomplished imageI'm sorry. Subplot (2, 4, 4), imshow (match1), title()'contribution to callhisteqI'm sorry. Subplot (2, 4, 5), imhist (image2), title()' histogram of the original imageI'm sorry. Subplot (2, 4, 6), imhist (image3), type()'the histogram of template imagesI'm sorry. Subplot (2, 4, 7), imhist (metch2), title()'hertogram after matchingI'm sorry. Subplot (2, 4, 8), imhist (metch1), title()'call histeq to get the right side of the image. FigureI'm sorry;3. Some descriptions of the matlab functions used:
= min(v); v is a vector in which the function returns value a, which represents the smallest value in v, and b, which represents the position of the smallest value, returns the first position when there are more than one minimum。
2. For functions with multiple returned values, such as two returned values, the parameters of the corresponding position can be replaced with ~ when accepted if all values are not required in the subsequent process. For example, for the min(v) function in the code, we do not need to use the minimum value, but only the position where the minimum value is, which can be used = min(v). If you need only the previous returns, you can omit the latter. For example: = min(v); returns the minimum value of v (a = min(v) and = min(v) equivalent)。
3. Histeq function (the description of this function can be seen by helping histeq in mattlab)
J = histeq(i, hist); i for the input of images, heist for histograms that match histograms, can be histograms of greyscale images expressed in different ways, e. G. Doule/single type (cross-coordinate range 0~1), uint8 type (cross-cot range 0~255), uint16 and int16
J = histeq(i, n); histogram balance function, i for input images, n for balanced greyscale level, with default value of 64。
= histeq(i); t for the greyscale transformation of the greyscale map of the greyscale image i to the medium grayscale j, the range of values is。
In addition, three functions for index image palettes are as follows:
Newmap = histeq
Newmap = histeq
= histeq(x,...)
4. The results of the operation of the code are as follows: